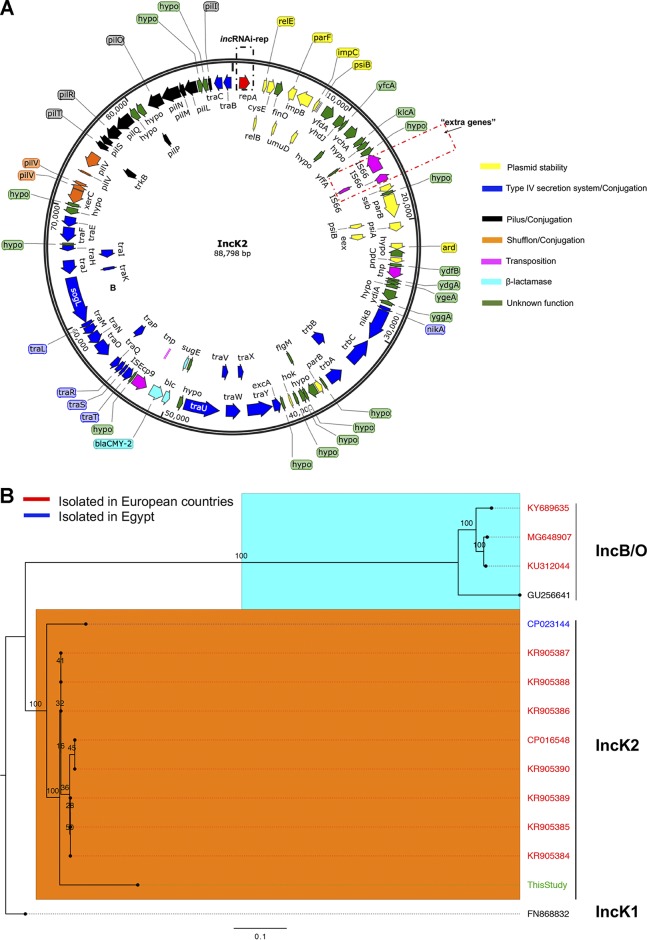
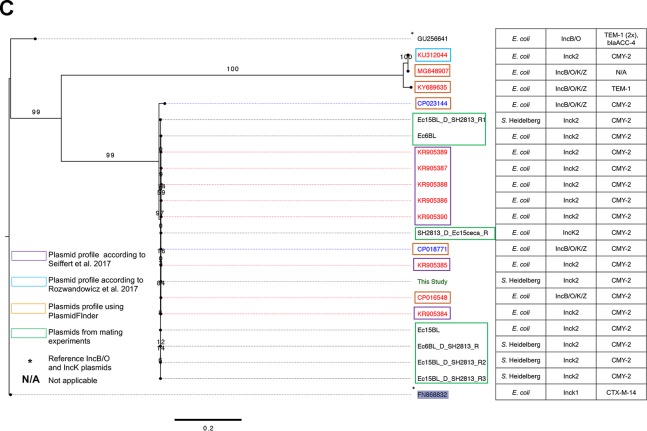
FIG 2.
IncK2 acquired by S. Heidelberg. (A) Annotated map of IncK2 plasmid from this study. The dashed red rectangular box shows the extra genes discussed in the text. (B) Maximum likelihood tree of IncB/O/K plasmids based on complete plasmid sequence alignment. (C) Maximum likelihood tree of IncB/O/K plasmids based on incRNAI and rep gene alignment. The TVM model of nucleotide substitution and GAMMA model of rate heterogeneity were used for sequence evolution prediction. Numbers shown next to the branches represent the percentages of replicate trees where associated taxa cluster together based on ∼100 bootstrap replicates. Trees were rooted with reference IncK1 plasmid (GenBank accession number FN868832). The plasmid map was drawn using SnapGene v 4.3.8.1. The tree was viewed using FigTree v 1.4.4. Sources for panel C are Rozwandowicz et al. (25) and Seiffert et al. (26).


