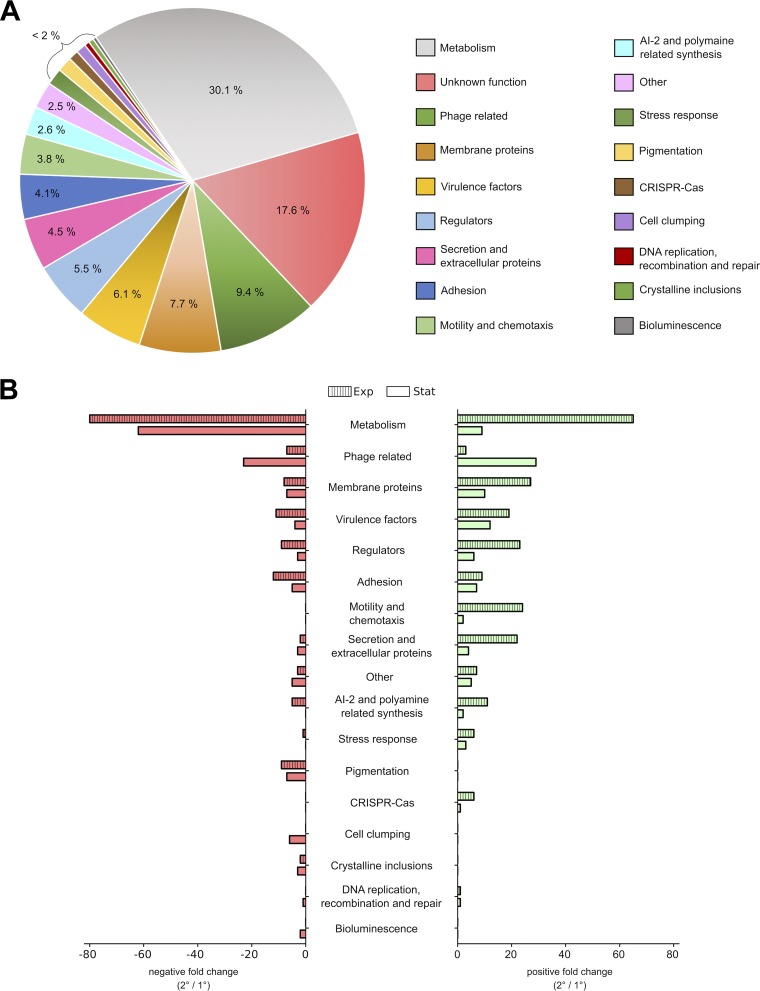
FIG 2.
Overview of genes differentially expressed in 2° cells compared to levels in 1° cells. (A) Division of the 638 DEGs according to their functionality into 19 subgroups. (B) Negative (red) and positive (green) FCs of all DEGs obtained at the exponential (Exp; striped bars) as well as stationary (Stat; plain bars) growth phase.

