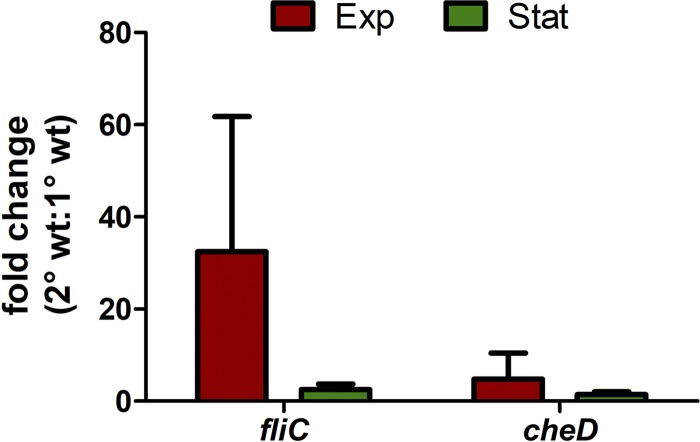
FIG 3.
RT-qPCR data on fliC and cheD displaying higher transcription in 2° than in 1° cells. RT-qPCR revealed a higher level of transcription of fliC and cheD in 2° cells than in 1° cells either in the exponential growth phase (red) or in the stationary phase (green); the fold change is significantly higher in the exponential growth phase for both genes. The data are presented as the fold change ratio of 2° cells to 1° cells with recA used as the housekeeping gene. Values are means of three independent biological replicates and were calculated using the Pfaffl method. wt, wild type.

