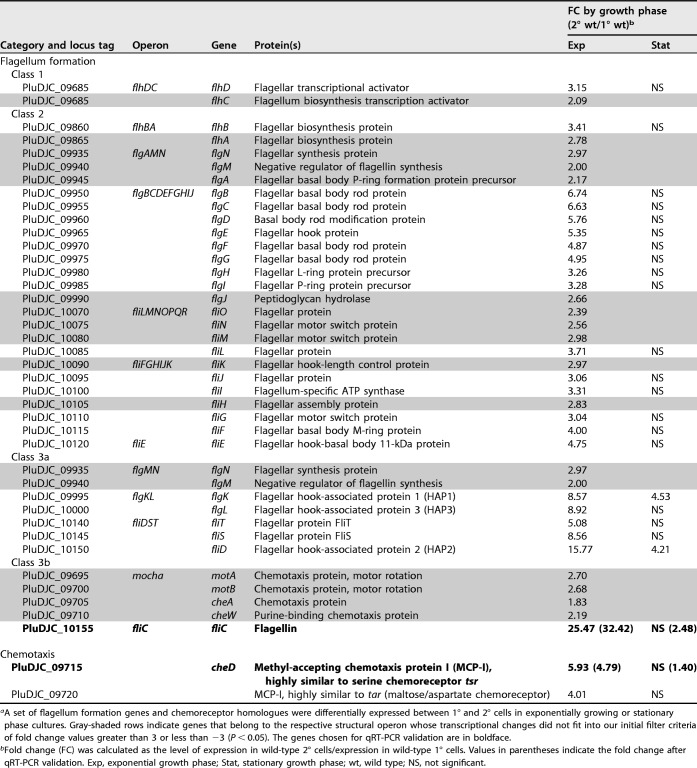
TABLE 2.
Motility- and chemotaxis-related genes transcribed at higher levels in 2° cells than in 1° cells in exponential or stationary growth phasea
A setof flagellum formation genes and chemoreceptor homologues were differentially expressed between 1° and 2° cells in exponentially growing or stationary phase cultures. Gray-shaded rows indicate genes that belong to the respective structural operon whose transcriptional changes did not fit into our initial filter criteria of fold change values greater than 3 or less than −3 (P < 0.05). The genes chosen for qRT-PCR validation are in boldface.
Fold change (FC) was calculated as the level of expression in wild-type 2° cells/expression in wild-type 1° cells. Values in parentheses indicate the fold change after qRT-PCR validation. Exp, exponential growth phase; Stat, stationary growth phase; wt, wild type; NS, not significant.

