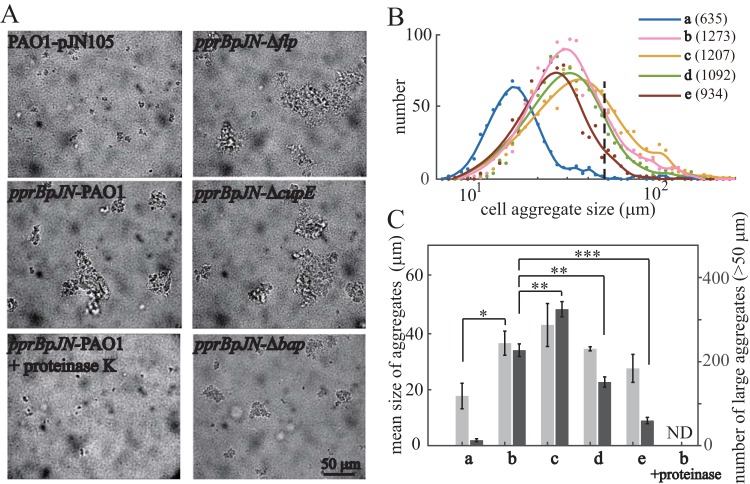
FIG 5.
PprB overexpression enhances CCA in P. aeruginosa. (A) Bright-field images of the exponential-phase bacterial cultures. (B) Size distribution of cell aggregates; total numbers of cell aggregates counted for each strain are in parentheses after strain labels. The distribution curves are the smoothing result of original data points using a smoothing spline method. The black dashed line indicates the position where cell aggregate size equals 50 μm in diameter. (C) Mean sizes of cell aggregates (light gray) and numbers of large aggregates (dark gray, cell aggregates >50 μm in diameter). Mean aggregate sizes are from three independent experiments and shown as the means ± SDs. Errors of large aggregates numbers are estimated from Poisson counts by , where N is the number of large aggregates. ND, not detected. Statistical analysis was based on pairwise comparisons between corresponding data in pprBpJN-PAO1 and data in other strains (t test). *, P < 0.05; **, P < 0.01; ***, P < 0.001. Strains used in panels B and C are as follows: a, PAO1-pJN105; b, pprBpJN-PAO1; c, pprBpJN-Δflp; d, pprBpJN-ΔcupE; e, pprBpJN-Δbap.

