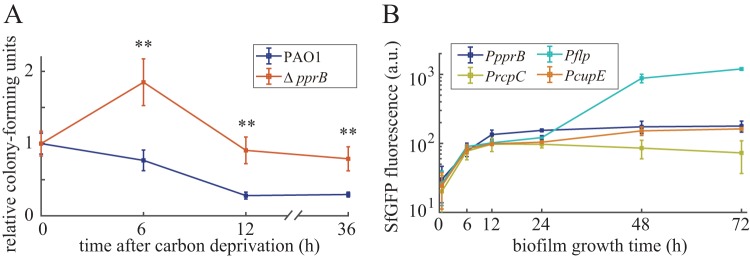
FIG 8.
(A) Relative CFU counts of wild-type and pprB mutant cells after carbon deprivation for 0, 6, 12, and 36 h under shaking conditions at 37°C. CFU data of each strain were normalized by data at 0 h. Data are from three independent experiments and shown as the means ± SDs. Statistical analysis was based on pairwise comparisons between PAO1 and the pprB mutant (t test). **, P < 0.01. (B) Time-dependent expression curves of pprB, flp, rcpC, or cupE genes in the wild-type cells grown in colony biofilms at 37°C.

