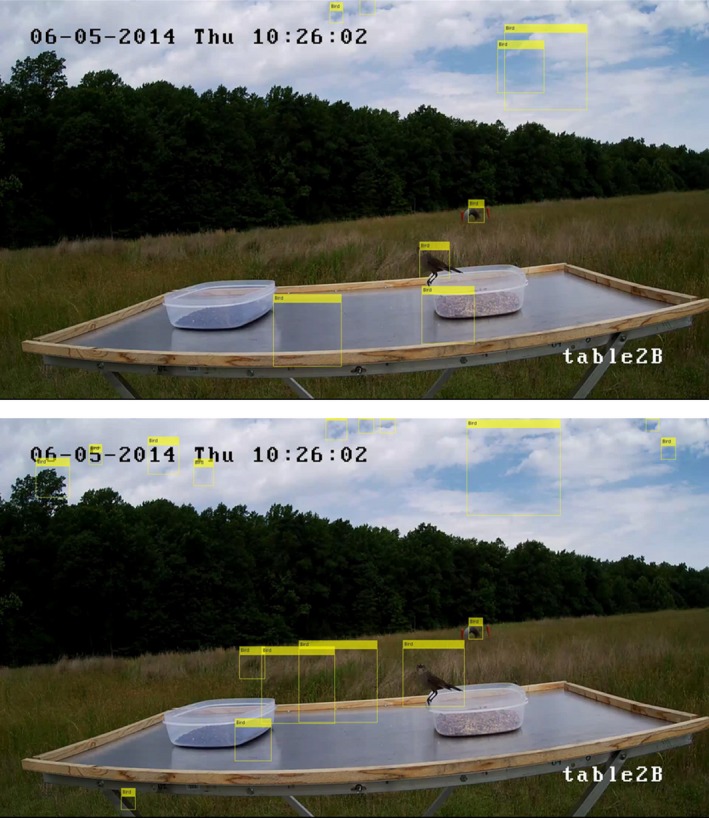
Figure 6.

Images of the same video frame captured by the camera pointed directly at table2B. The yellow rectangles labeled “Bird” in each of the images show the bounding boxes where birds were detected using the object detection algorithm. The top image used the LBP feature detector, and the bottom image used the Haar feature detector. In both of these images it appears the automated bird detection method correctly identified the bird, but using an IoU threshold of 0.5 only the Haar feature detector produced a true‐positive detection. These images also show how weather and lighting affect the bird detection. The cloud coverage resulted in many false‐positive detections using both features
