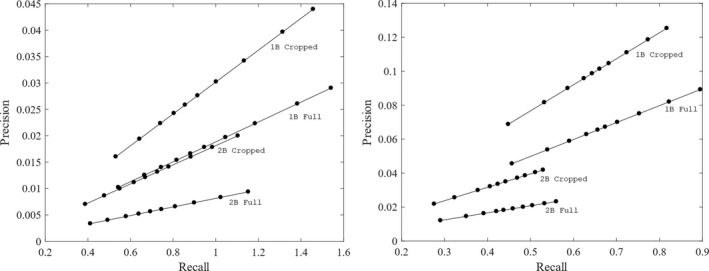
Figure 11.

These plots show the precision versus recall for both detectors on the full and cropped images. The left plot used the Haar detector and the right plot is of the LBP detector. On each line, the filled circle closest to the origin is the IoU threshold of 0.5 and decrease by increments of 0.05 moving left to right. Each line is labeled with the food table and size of the image used. From these plots, it can be seen that the LBP feature detector had consistently higher precision values than the Haar feature detector. This is because the the LBP feature detector had fewer false positives. It can also be seen that the Haar feature detector had higher recall than the LBP feature detector, meaning that there were more true‐positive detections using the Haar feature detector. In all cases, the precision increased by cropping the images to include just the area around the food table. This is due to the reduction in false positives created by clouds and background clutter in the image. The recall decreased slightly by cropping the images. This is because the object detector was trained using the full images and therefore expected some amount of space between the bird and the edge of the image. Cropping the images decreased this space and resulted in fewer true‐positive detections of the birds near the edges of the images
