
Figure 4.
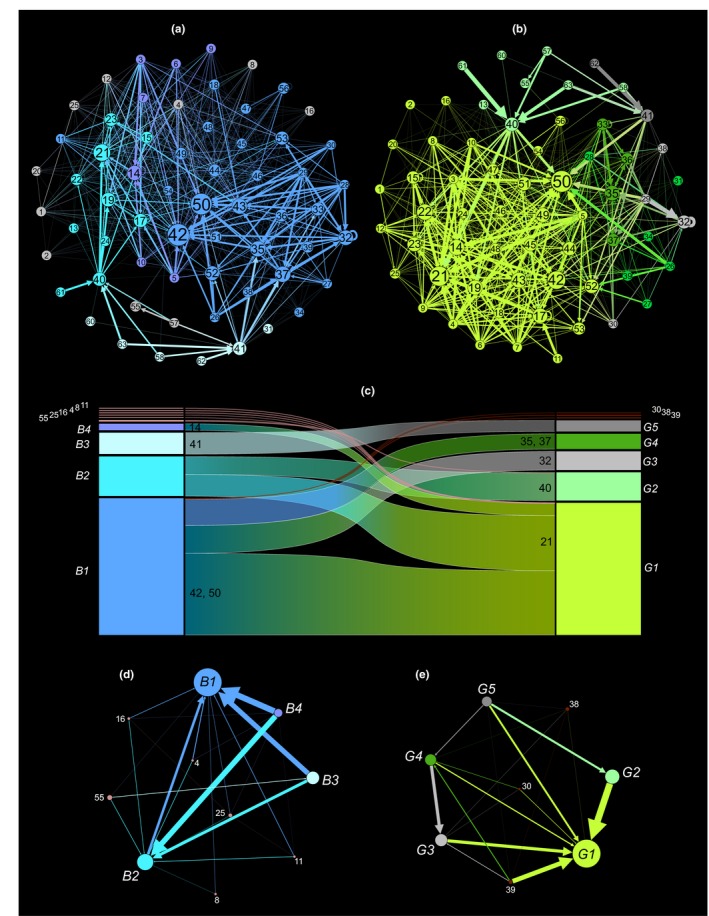
Modularity reshuffling in the planktonic food web from the Gulf of Naples (Italy) between oligotrophic, or blue, and eutrophic, or green, states. (a, b) Weighted networks derived for the planktonic food web at blue and green states, respectively, produced by the Gephi software (Bastian et al., 2009) using the Fruchterman–Reingold, force‐directed layout algorithm (Fruchterman & Reingold, 1991). Network nodes are different species or species groups of the food web, as indicated in Table 1; nodes' dimension is proportional to their weighted degree as estimated by Gephi; links' weight is proportional to the dimension of carbon flows among web nodes; and nodes colors remark their association to different modules, as based on weighted and directed modularity analyses (see M&M's). (c) Alluvial diagram depicting how the different nodes redistribute among the modules as the network shifts between blue and green configurations; colors are alike those in (a, b) and indicate the main network modules, which are represented as rectangles whose dimension is proportional to the fraction of carbon flows within each module. Groups of nodes shifting between modules at blue‐green transitions are represented as stream fields, whose thickness is proportional to the group's contribution to the module outflow; light and dark red streams indicate the translation of nodes belonging to recessive modules made of few or a single node. (d, e) Aggregated net fluxes among modules in simplified networks for the blue and green networks, respectively; colors are as in (a–c), nodes are modules, nodes' size is proportional to the fraction of carbon flow within each module, and links' weight is proportional to the dimension of carbon flow among modules