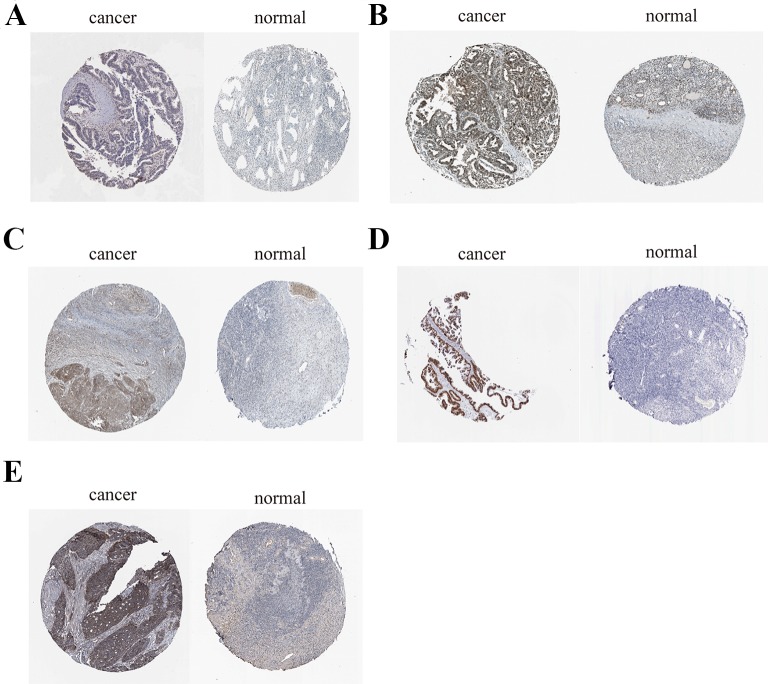
Figure 13.
Immunohistochemistry of the five key genes based on the Human Protein Atlas. (A) Protein levels of CDCA5 in tumor tissue (staining: low; intensity: weak; quantity: > 75%). Protein levels of CDCA5 in normal tissue (staining: not detected; intensity: weak; quantity: < 25%). (B) Protein levels of FOXM1 in tumor tissue (staining: high; intensity: strong; quantity: > 75%). Protein levels of FOXM1 in normal tissue (staining: medium; intensity: moderate; quantity: 75–25%);. (C) Protein levels of KIF15 in tumor tissue (staining: medium; intensity: moderate; quantity: > 75%). Protein levels of KIF15 in normal tissue (staining: not detected; intensity: weak; quantity: < 25%). (D) Protein levels of MCM2 in tumor tissue (staining: high; intensity: strong; quantity: > 75%). Protein levels of MCM2 in normal tissue (staining: medium; intensity: moderate; quantity: 75–25%). (E) Protein levels of ZWINT in tumor tissue (staining: high; intensity: strong; quantity: > 75%). Protein levels of ZWINT in normal tissue (staining: low; intensity: weak; quantity: > 75%).

