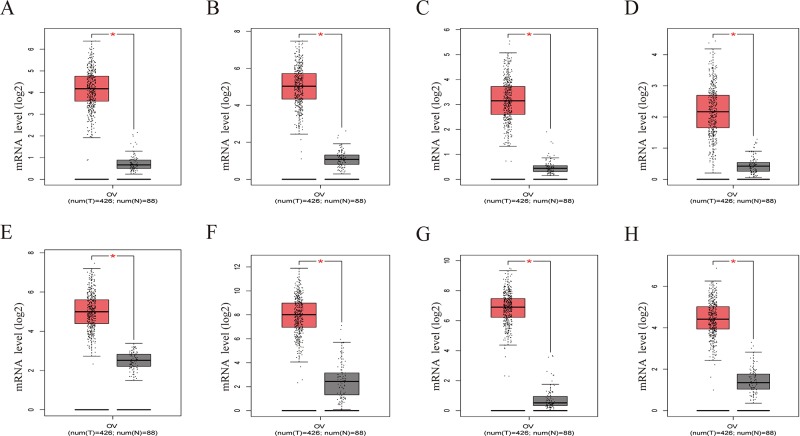
Figure 8.
Gene Expression Profiling Interactive Analysis (GEPIA) was performed to validate higher expression of eight hub genes in EOC samples compared with normal samples. Red box was the cancer tissue group, gray was the normal tissue group, and asterisk represented p < 0.01. The dots represented expression in each sample. (A) CDCA5, (B) FOXM1, (C) KIF11, (D) KIF15, (E) MCM2, (F) SPP1, (G) UBE2C, (H) ZWINT.

