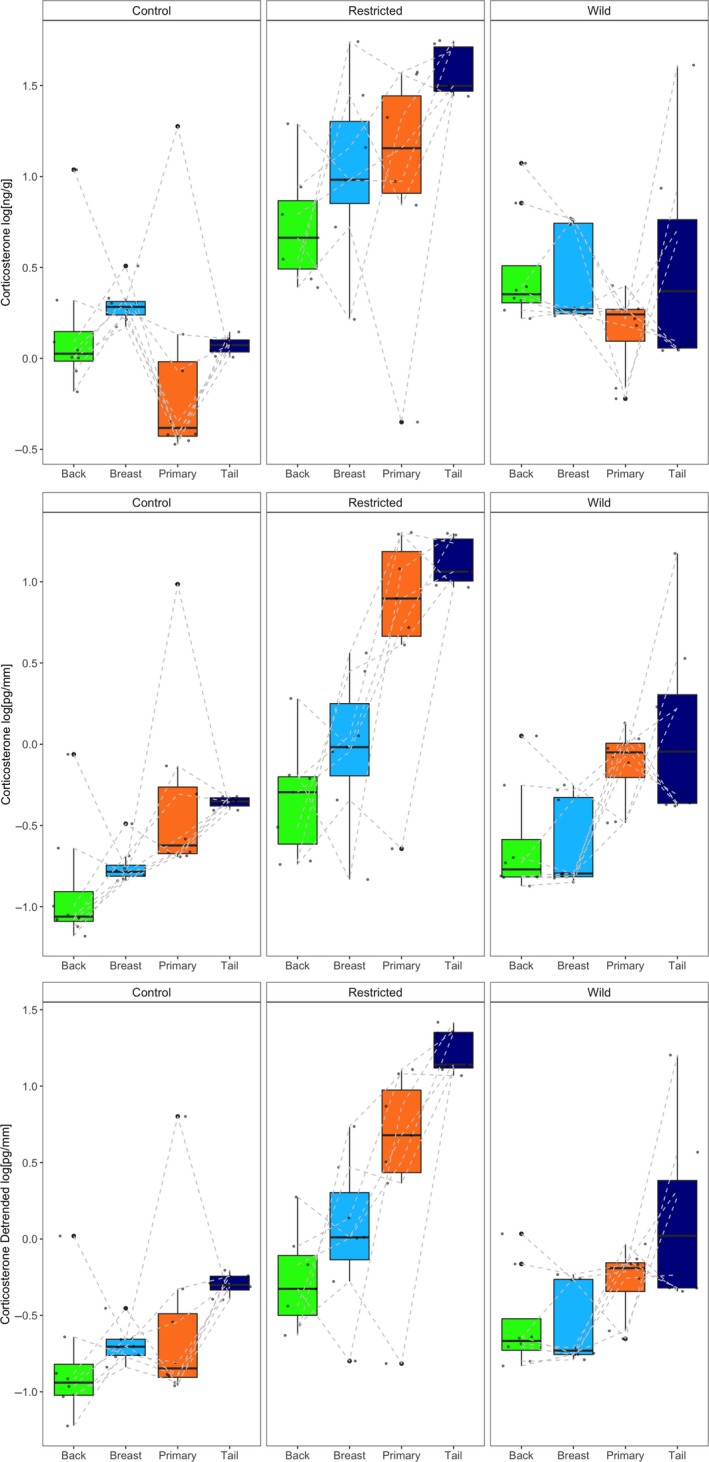
Figure 5.

Boxplots depict the median and distribution of corticosterone concentrations standardized by sample weight (top), length (middle), and length detrended for mass (bottom) of back, breast, primary, and tail feather samples from captive and wild reared (n = 8) rhinoceros auklets. Birds raised in captivity were fed either a control (n = 8) or restricted (n = 7) diet. Raw data are overlaid, and individuals are connected with a light gray dashed line
