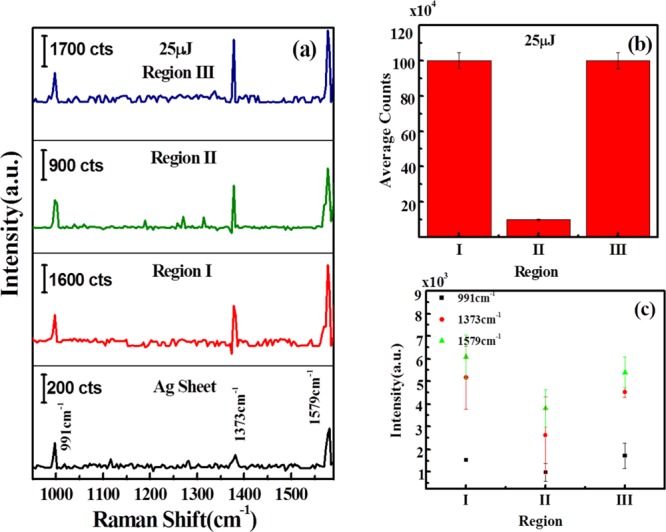
Figure 7.

(a) Raman spectra of AgNPs, showing silver peaks on Ag sheet and variation of Ag peaks in regions I, II, and III on laser-ablated Ag–S obtained at 25 μJ of input laser energy; (b) variation of average intensity counts in regions I, II, and III on laser-ablated Ag–S; and (c) variation of intensities of 991, 1373, and 1579 cm–1 signature peaks of Ag–O at regions I, II, and III on laser-ablated Ag–S ablated at 25 μJ. “a.u.” stands for arbitrary units in the figure.
