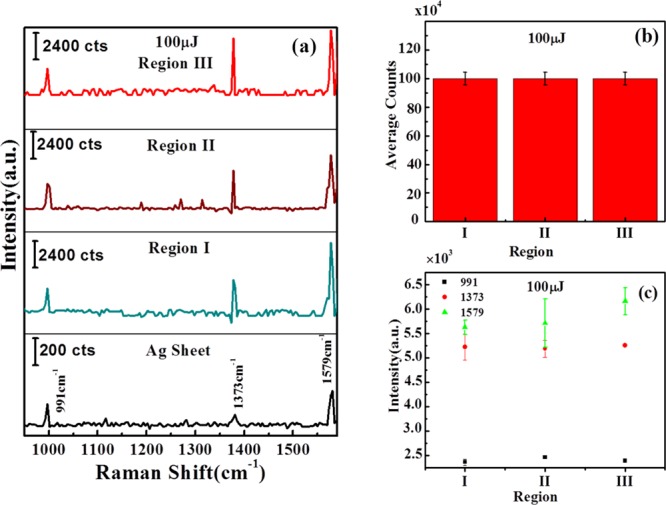
Figure 9.

(a) Raman spectra of Ag–S, showing silver peaks on Ag sheet and variation of Ag peaks; (b) variation of average intensity counts in regions I, II, and III on laser-ablated Ag–S obtained at 100 μJ of input laser energy, and (c) variation of intensities of 991, 1373, and 1579 cm–1 signature peaks of silver NPs at regions I, II, and III on Ag–S ablated at 100 μJ. “a.u.” stands for arbitrary units in the figure.
