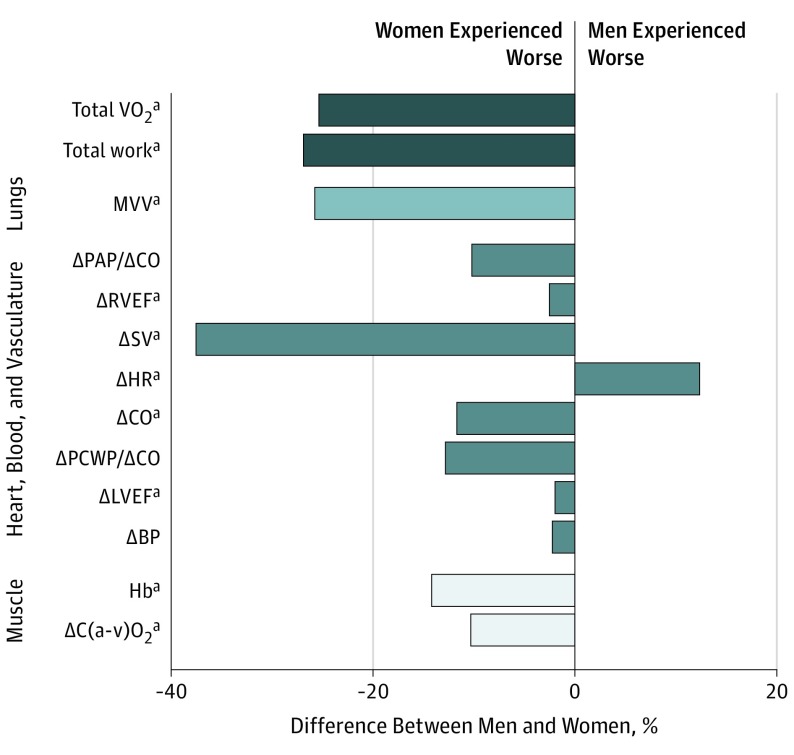
Figure 1. Association of Sex With Traits and Deficits.
The schematic depicts the sequence of inspired oxygen (O2) transport from inspired air to muscle. The bar graph depicts the percentage difference in absolute values or deltas (peak minus rest values) between men and women. BP indicates blood pressure; C (a − v) O2, peripheral oxygen extraction; CO, cardiac output; Hb, hemoglobin; HR, heart rate; LVEF, left ventricular ejection fraction; PAP, pulmonary artery pressure; PCWP, pulmonary capillary wedge pressure; RVEF, right ventricular ejection fraction; SV, stroke volume; VO2, oxygen consumption; VCO2, carbon dioxide production.
aP < .05.

