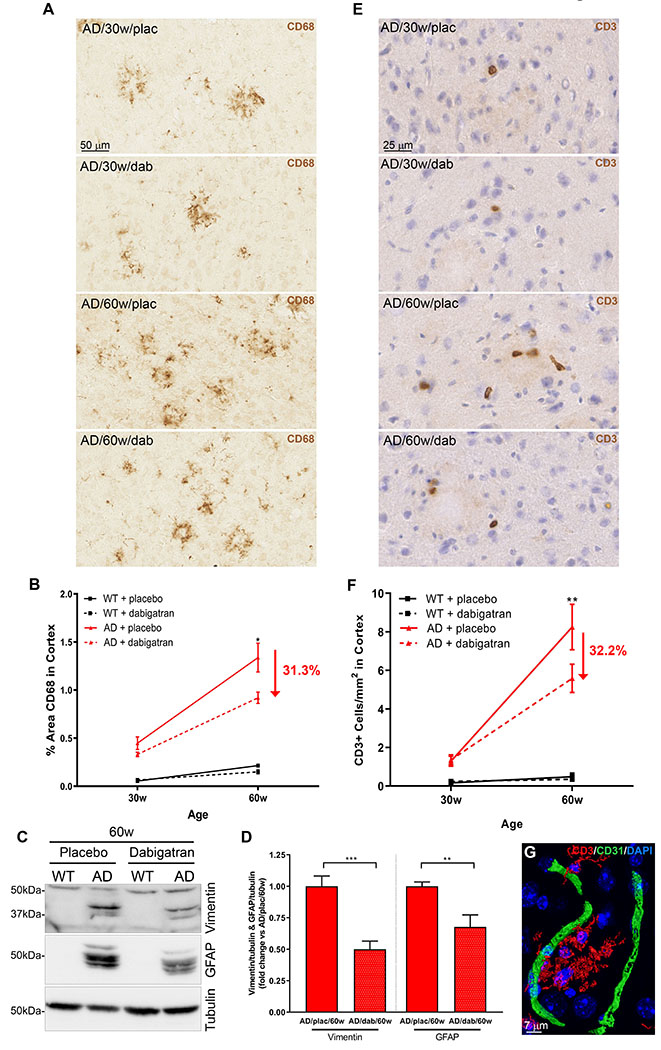
Figure 6. Dabigatran treatment ameliorated neuroinflammation in AD mice.

(A) Immunohistochemical analysis showed CD68-positive microglial clusters in 30- and more numerously in 60-week-old AD mice. (B) Quantification of the CD68-positive cortical area showed a 31.3% decrease in the amount of phagocytic microglia in 60-week-old dabigatran-treated AD mice compared to placebo. (C) Soluble proteins from 60-week-old mice were extracted, pooled, and subjected to WB using a vimentin antibody (top panel), and then re-probed with a GFAP antibody (middle panel) and a tubulin antibody (loading control, bottom panel). Six different WBs were quantified, averaged and plotted (D). Degradation products of vimentin and GFAP astrocytic markers drastically increased in AD mice compared to WT mice (53) but their levels were ameliorated in dabigatran-treated AD mice by 50% and 32.3%, respectively. (E) Immunohistochemical staining showed scattered CD3-positive cells in 30-week-old AD brains that increased with age and pathology. (F) Quantification of CD3-positive cells in the cortex showed that infiltrated T cells significantly decreased by 32.2% in dabigatran-treated AD mice compared to placebo. (G) Double immunofluorescence showed that CD3-positive cells (red) were not inside blood vessels (CD31, green) but rather were extravasated into the brain parenchyma. (B&F) The cortical area quantified was similar to the one outlined in the low power images in Figure 5A. Graphs show mean±SEM. The effect of treatment and age were significant (p˂0.0001 for both). *p≤0.05; **p≤0.01; ***p≤0.001 AD/60w/placebo vs. AD/60w/dabigatran. n=5-11 mice/group (A-F) and n=5-6 mice/group (C&D). GFAP=glial fibrillary acidic protein. Other abbreviations as in Figure 1.
