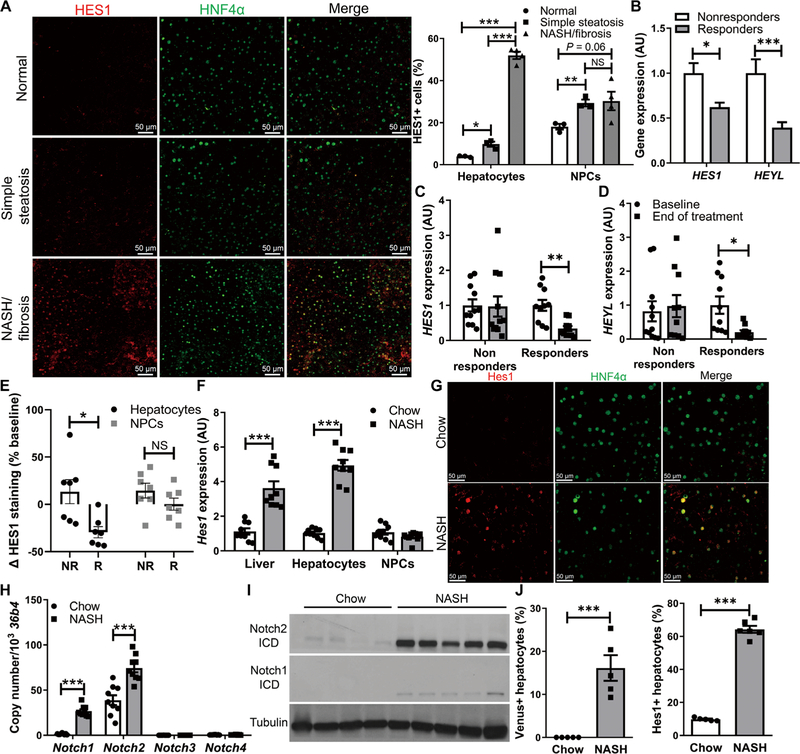
Fig. 1. Hepatocyte Notch activation in NASH.
(A) Representative images of HES1 (red) and hepatocyte nuclear factor 4α (HNF4α; green) immunofluorescence in liver biopsies from patients with histologically normal liver, SS, or NASH/fibrosis and quantification of the percentage of HES1+ cells among HNF4α+ hepatocytes and HNF4α− nonhepatocytes (n = 3 to 4 per group). (B) Expression of Notch target genes HES1 and HEYL after 96 weeks of treatment in nonresponders (n = 49) or responders (n = 69) from the PIVENS trial. (C) Liver HES1 and (D) HEYL expression in paired baseline and 96-week end-of-treatment liver biopsy specimens from PIVENS subjects (n = 10 to 11 per group) and (E) percentage change of HES1+/HNF4α+ hepatocytes and HES1+/HNF4− NPCs in nonresponders (NR) and responders (R) from baseline to end of treatment (n = 7 per group). (F) Hes1 expression in liver, fractionated hepatocytes, and NPCs. (G) Representative images of Hes1 and HNF4α immunofluorescence in chow- and NASH diet–fed WT mouse livers and quantification of the percentage of hepatocytes with nuclear Hes1 staining (n = 9 per group). (H) Expression of Notch receptors in hepatocytes and (I) Western blots of Notch1 and Notch2 intracellular domains (ICDs) in livers from chow- and NASH diet–fed WT mice. (J) Quantification of Venus+ hepatocytes in livers from chow- and NASH diet–fed Notch reporter mice (n = 5 per group). *P < 0.05, **P < 0.01, and ***P < 0.001 as compared to the indicated controls by two-tailed t tests (two groups) or one-way analysis of variance (ANOVA), followed by post hoc t tests (three groups). All data are shown as the means ± SEM. NS, not significant; AU, arbitrary units.

