
Fig. 5. Notch-induced hepatocyte Opn activates HSCs and induces liver fibrosis.
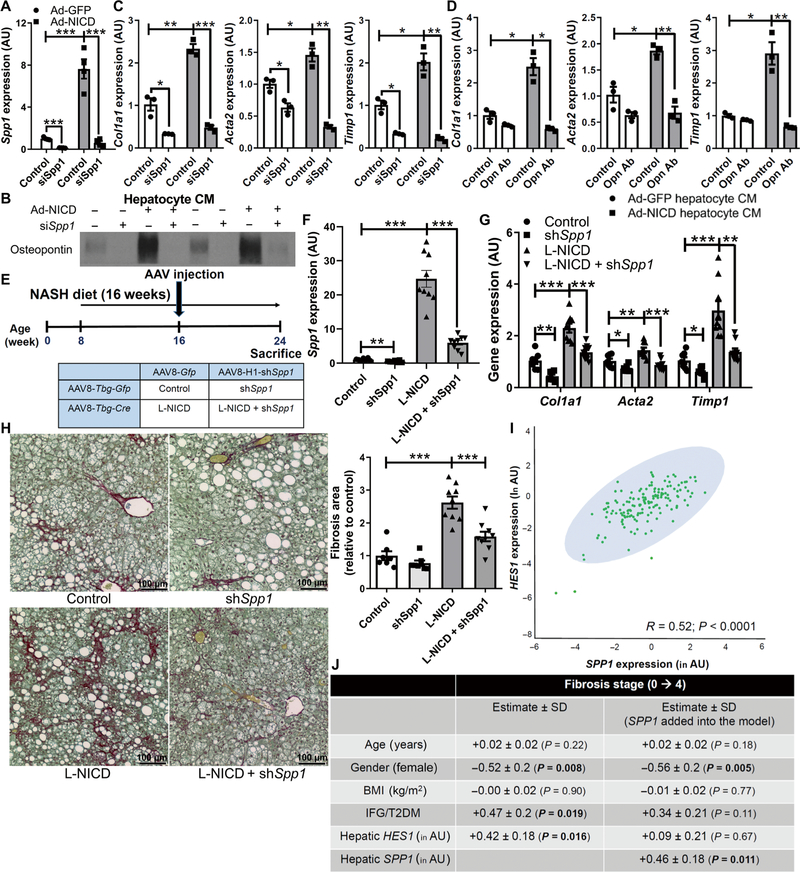
(A) Hepatocyte Spp1 expression (n = 4 per group) and (B) Opn secreted in hepatocyte CM from control or Notch-activated hepatocytes transfected with siRNA directed against Spp1 (siSpp1) or scrambled control. Expression of fibrogenic genes in HSCs exposed to CM (C) from control or Notch-activated siSpp1-transfected hepatocytes (n = 3 per group) or (D) CM pretreated with an Opn-neutralizing antibody (Opn Ab; n = 3 per group). (E) RosaNICD mice (8 weeks old) were fed with NASH diet for 8 weeks and then transduced with AAV8-TBG-Gfp or AAV8-TBG-Cre (to generate control and L-NICD mice, respectively) and simultaneously with AAV8-H1-Gfp or AAV8-H1-shSpp1 (n = 7 to 9 per group). (F) Spp1 and (G) fibrogenic gene expression and (H) collagen staining and quantification in livers from control and L-NICD mice transduced with shSpp1 (short hairpin–mediated RNA–transfected Spp1). *P < 0.05, **P < 0.01, and ***P < 0.001 as compared to the indicated controls by one-way ANOVA, followed by post hoc t tests (more than two groups). All data are shown as the means ± SEM. (I) Correlation between HES1 and SPP1 expression in liver biopsies from patients at risk of NASH (n = 159). (J) Table of association between HES1 expression and liver fibrosis stage after adjustment for key demographic variables (left column) or when additionally adjusted for SPP1 expression (right column). Expression of HES1 and SPP1 was log transformed to ensure the assumption of normal distribution. All data in the table are shown as the regression estimates ± SD and P values, which were generated by multivariate ordinal regression analyses. BMI, body mass index; IFG, impaired fasting glucose; T2DM, type 2 diabetes mellitus.