
Fig. 2.
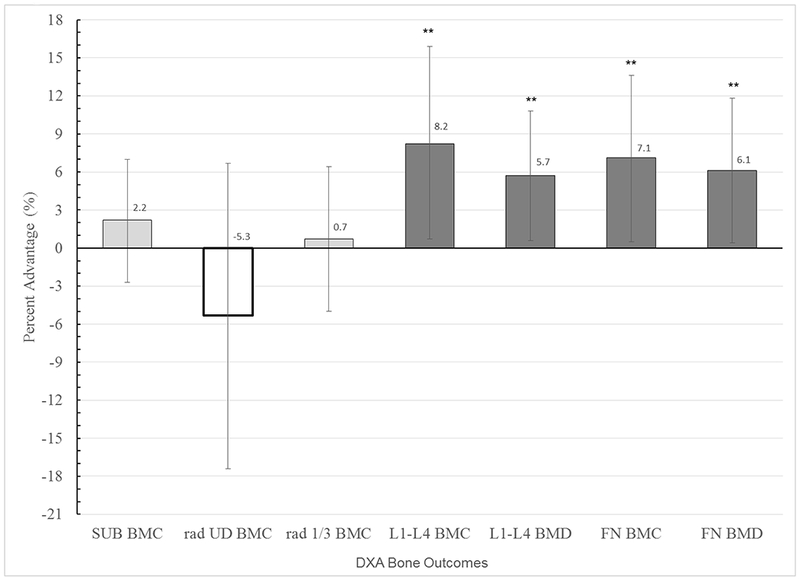
Mean Bone Gain Percent Advantage for HI versus CON (high compliance analysis)
For each bone outcome, adjusted mean percent advantages in bone gain from baseline to follow-up (FU2), are presented for HI (bar) relative to CON (x axis, zero line), with 95% confidence intervals. Means are adjusted for the following covariates: inter-scan interval, Mean Non-intervention Organized Activity over the interval, Maturity level, Baseline Height, Height Change, Mean Ca and ln Mean vitamin D. ** indicates p < 0.01