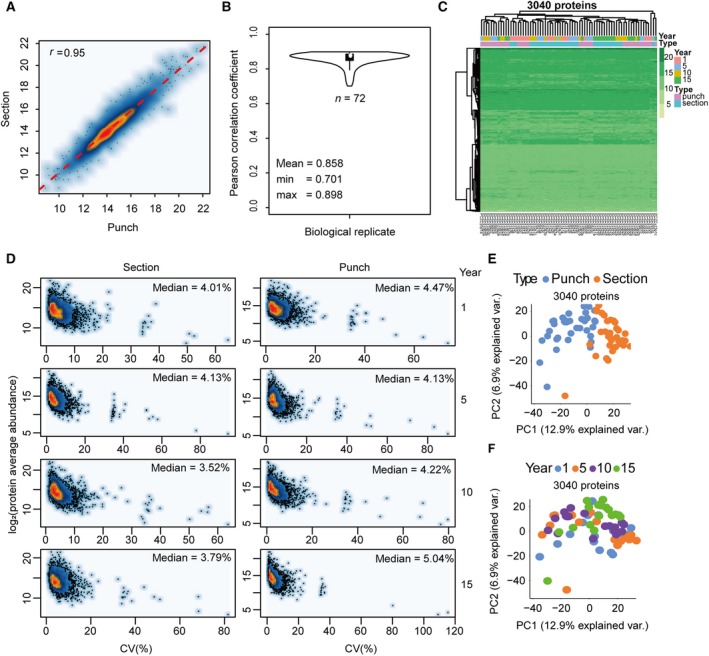
Figure 3.

Evaluation of FFPE tissue storage forms and duration. (A) Pearson correlation of protein abundance between FFPE micrometer sections and punches. (B) Average Pearson correlation coefficient of all 72 samples among three biological replicates. The ‘pairwise.complete.obs’ method was employed to calculate the COR value to avoid the influence of NA. (C) The protein abundance distribution of all 3040 SwissProt proteins across all 72 samples with different tissue types and storage time. (D) CV plots for each sample type (section/punch) with different storage time (1, 5, 10, and 15 years). (E) PCA of the effect of tissue types. (F) PCA of the effect of storage time.
