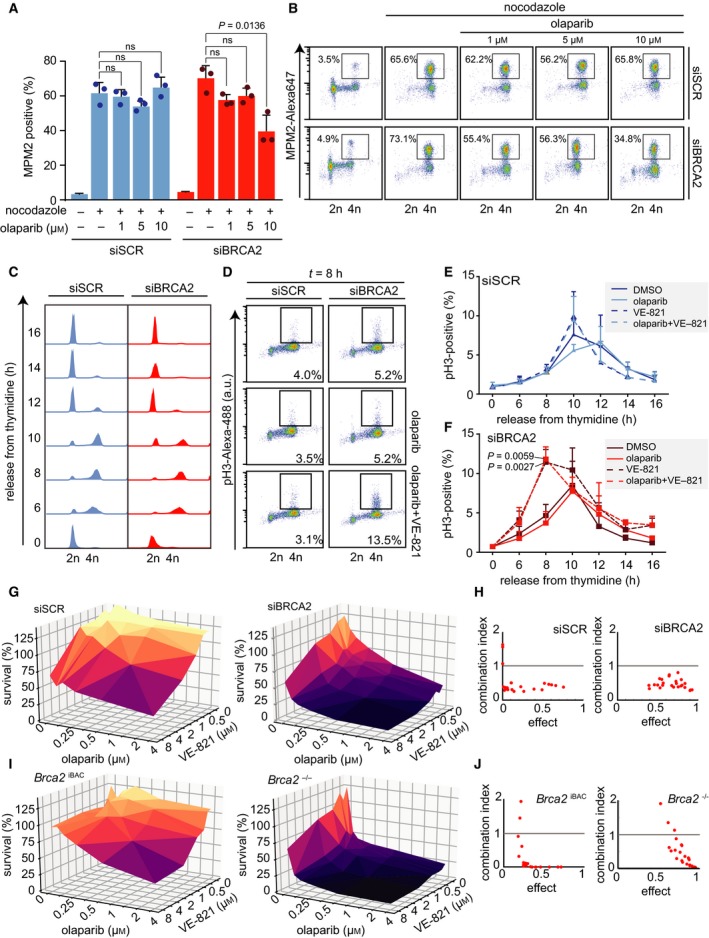
Figure 1.

ATR inhibition induces premature mitotic entry and is synergistically cytotoxic with PARP inhibition. (A) HeLa cells were transfected with control (siSCR, #12935300) or BRCA2 (‘siBRCA2 #1’, #HSS186121) siRNAs for 24 h and subsequently treated with DMSO and/or olaparib (1, 5, or 10 µm) 24 h prior to harvesting. Next, cells were treated with nocodazole (250 ng·mL−1) for 18 h. DNA content (propidium iodine) and MPM2‐Alexa‐647 were assessed by flow cytometry on a Becton Dickinson FACSCalibur (Becton Dickinson). A minimum of 10 000 events were analyzed per sample. Averages and standard deviations of three biological replicates are shown (n = 3). P values were calculated using two‐tailed Student’s t‐test. (B) Representative MPM2‐Alexa‐647 plots are shown of HeLa cells treated as described in panel A. (C, D) HeLa cells were transfected with control or BRCA2 siRNAs for 24 h and subsequently incubated with thymidine (2 mm) for 17 h. Cells were then released for 9 h in prewarmed growth media and again treated for 17 h with thymidine prior to release in growth media supplemented with DMSO, olaparib (1 µm), and/or VE‐821 (1 µm). Cells were harvested at the indicated time points for flow cytometry analysis. DNA content (propidium iodine) and pH3‐Ser10/Alexa‐488 were assessed by flow cytometry on a Becton Dickinson FACSCalibur (Becton Dickinson). A minimum of 10 000 events were analyzed per sample. Representative DNA plots are shown in panel C. Representative phospho‐Ser10‐histone‐H3 plots are shown in panel D. (E, F) Quantification of results of panel D. Averages and standard deviations of three biological replicates are shown. P values were calculated using a two‐tailed Student’s t‐test. (G) HeLa cells were transfected with control siRNAs or siRNAs targeting BRCA2 and were treated with the indicated concentrations of olaparib and/or ATR inhibitor VE‐821. Methyl‐thiazol tetrazolium (MTT, 0.5 mg·mL−1) was added for 4 h, and viability was assessed by colorimetric measurement. (H) Combination indices (CI) for HeLa cell treated as described in panel g were determined using compusyn software (Compusyn Inc., New York, NY, USA). (I) KB2P1.21 (‘Brca2 −/−’) and KB2P1.21R1 (‘Brca2 iBAC’) cells were treated and analyzed as described in panel g. (J) CI for treatments in Brca2 iBAC and Brca2 −/− cells were determined using compusyn software.
