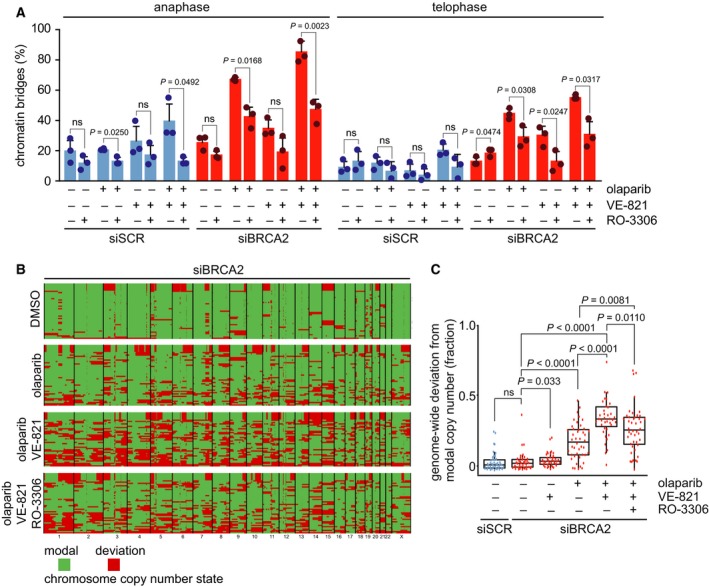
Figure 4.

CDK1 inhibition prevents mitotic aberrancies and genomic instability induced by combined ATR and PARP inhibition. (A) HeLa cells were transfected with siSCR or siBRCA2 (siBRCA2 #1) for 24 h and were treated as indicated with olaparib (0.5 μm), VE‐821 (1 μm). Simultaneously, the CDK1 inhibitor RO‐3066 (10 μm) was added to cells for 24 h, to delay G2/M cell cycle transition. Subsequently, RO‐3066 was removed, and after 90 min, cells were fixed and stained for α‐tubulin (red) and counterstained with DAPI (white). Percentages of chromatin bridge‐positive cells (n = 15 events per condition, per experiment). Averages and standard deviations of three biological replicate experiments are shown. P values were calculated using two‐tailed Student’s t‐test. Throughout the figure, ‘ns’ indicates not significant. (B) HeLa cells were treated as in panel a and were harvested and frozen in medium containing 20% DMSO after 24 h. Cells were lysed and stained using Hoechst/PI, and single G1 nuclei were sorted. Genomic DNA was isolated from 46 single nuclei, and genomic libraries were included depending on library quality. Each row represents a single cell. Genome‐wide copy number plots were generated using the AneuFinder algorithm (see Section 2). Modal copy number states per ~ 1‐Mb bin are indicated: Green indicates modal copy number, whereas red indicates deviation from modal copy. Summary plots of indicated treatments are shown. Original ploidy scores are shown in Fig. S4. (C) Quantification of data from panel b, showing the fraction of bins per individual library deviating from the sample modal copy number. Statistical significance was determined using a Wilcoxon rank sum test (Mann–Whitney).
