FIGURE 1.
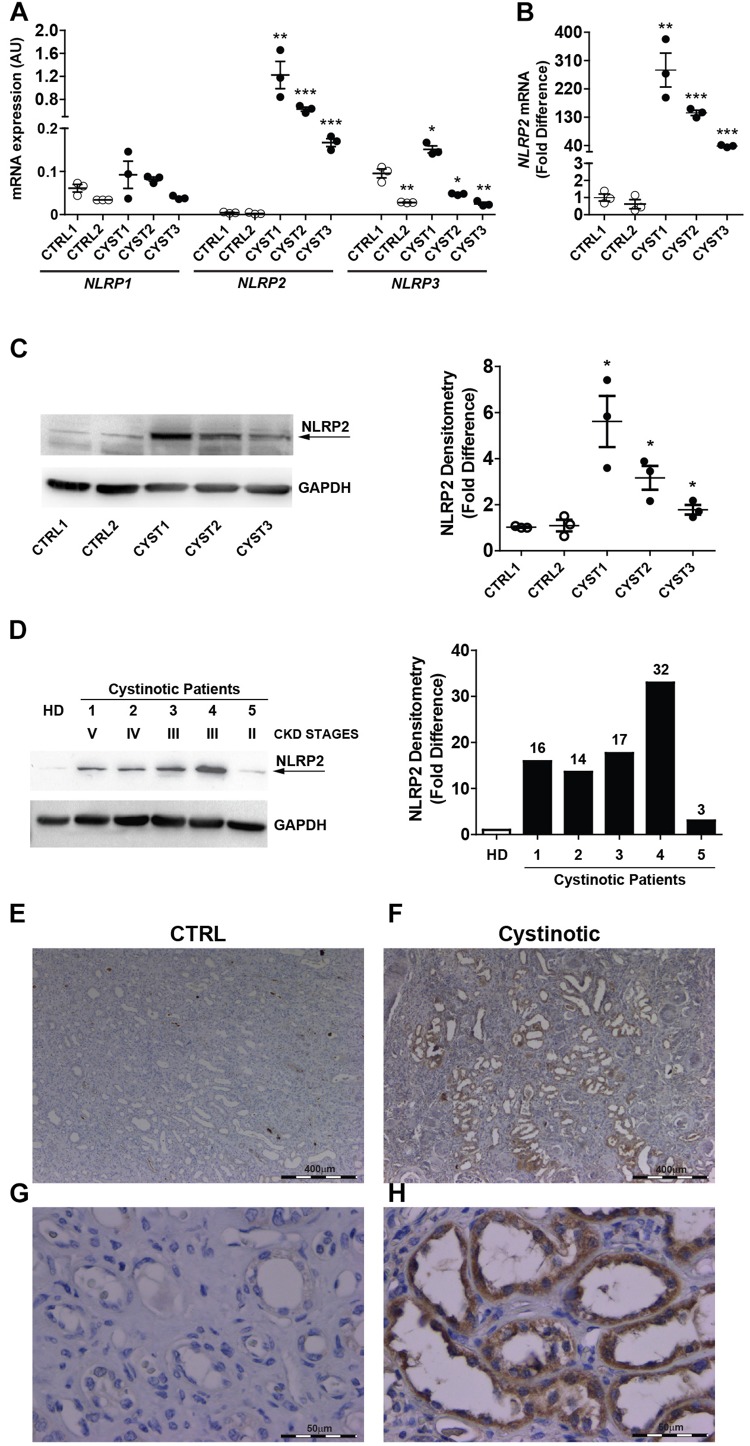
NLRP2 expression is upregulated in cystinotic proximal tubular epithelial cells. (A,B) NLRP1, NLRP2, and NLRP3 mRNA expression levels were evaluated by qPCR analysis in 2 control (CTRL1 and CTRL2) and 3 cystinotic (CYST1, CYST2, and CYST3) conditionally immortalized PTEC lines. Results are obtained after normalization with the housekeeping gene HPRT1 and are expressed as arbitrary units (AU) (A) and for NLRP2 as fold difference (B) versus the CTRL1 cell line. Differences between groups were compared using the parametric ANOVA test (p > 0.5 for NLRP1 and p < 0.0001 for NLRP2 and NLRP3) and, if significant, unpaired t-test was applied, comparing each cell line versus the CTRL1 cell line. (C) Representative western blot showing NLRP2 protein upregulation in cystinotic PTEC compared to control PTEC. The arrow indicates the specific NLRP2 upper band. GAPDH is used as loading control (left panel). Densitometric analysis of NLRP2 normalized to the corresponding band intensity of GAPDH (right graph) confirmed the upregulation of NLRP2 in cystinotic cells. The data represent mean ± SEM from at least three independent experiments and are reported as fold difference versus CTRL1 cell line. (D) Western Blot and densitometric analysis of NLRP2 protein levels in primary PTEC isolated from urine of 5 cystinotic patients and 1 healthy subject (HD). For each patient, the chronic kidney disease (CKD) stage at time of urine collection is reported. Immunoblot data shown are representative of more than three independent experiments. ∗p < 0.05 or ∗∗p < 0.01 or ∗∗∗p < 0.001. (E,H) Kidney biopsy specimens from one representative healthy subject (CTRL) and one cystinotic patient (F,H) were stained with an antibody against NLRP2, revealing a strong staining of NLRP2 specifically in proximal tubular epithelial cells of cystinotic kidney. (E,F) 5X magnification, (G,H) 60X magnification.

