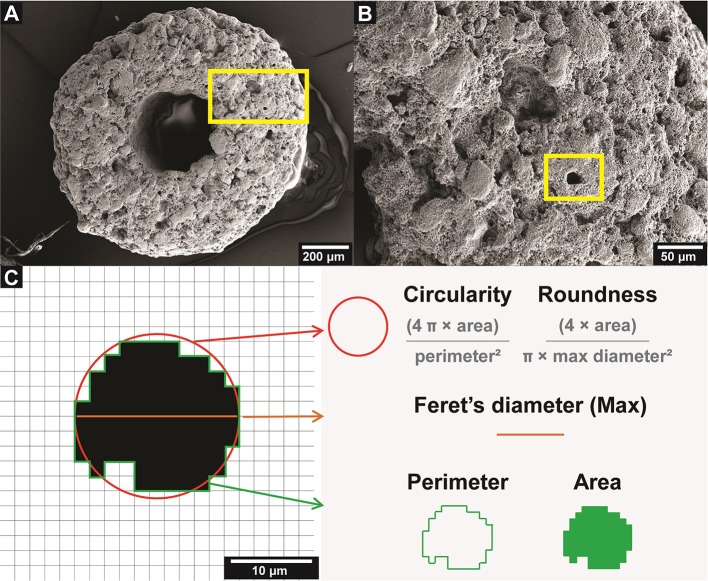
Figure 1.
CaP bioceramic particle microarchitecture. (A) SEM micrograph of the bioceramic surface. (B) Area of interest marked in (A), showing the microporosity of the bioceramic, the yellow square indicates a representative micropore. (C) Diagram of the five attributes measured for each micropore, based on Rueden et al. (2017).

