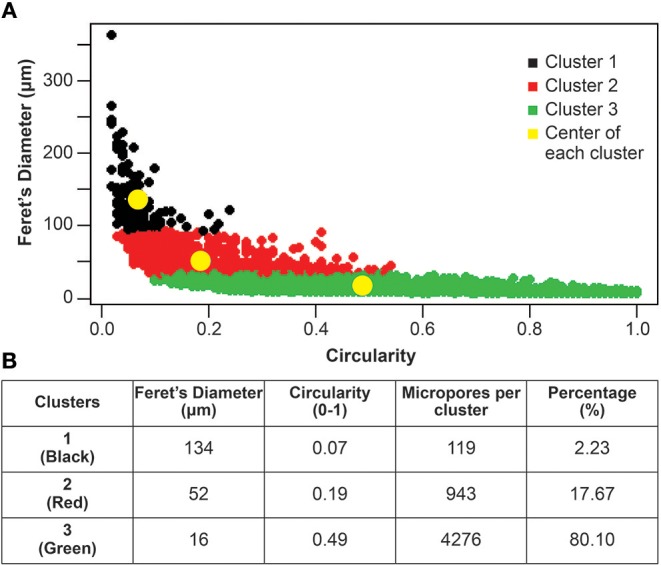
Figure 3.

The three micropores clusters based on Feret's diameter and circularity. (A) The three clusters of micropores are highlighted in black (1), red (2), and green (3). The yellow dots indicate the centers of each cluster. (B) Table showing the Feret's diameter and the circularity of the centers of each cluster (yellow dots in A). It also indicates the number of micropores that belong to each cluster and their representative percentage within the bioceramic particles.
