
Fig. 2.
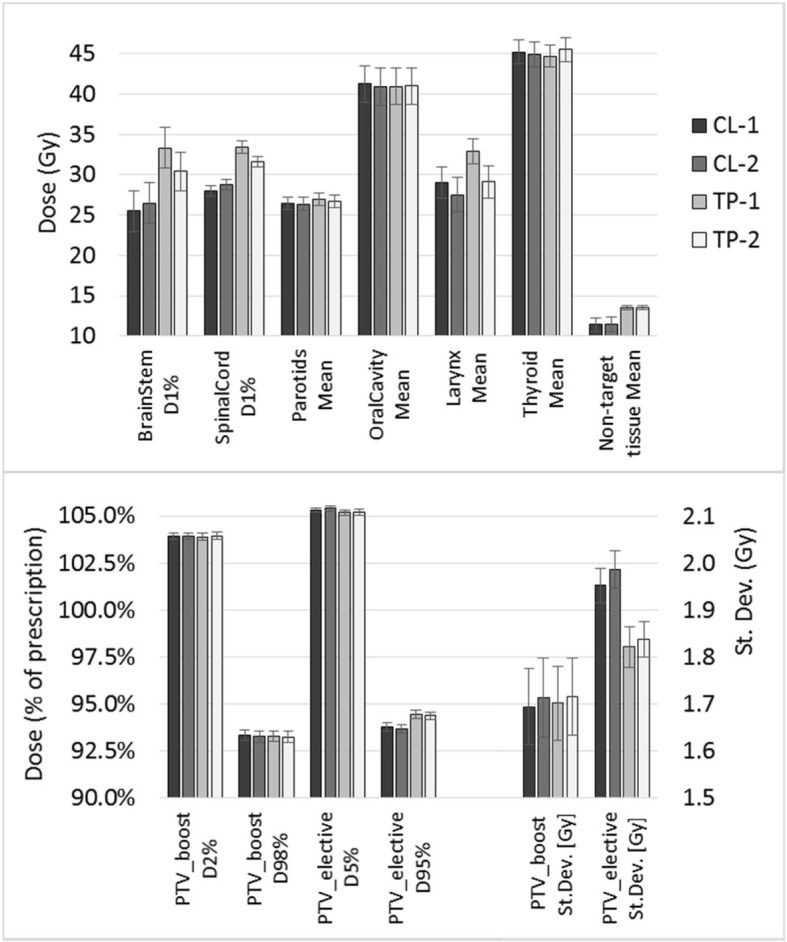
Dosimetric results, averaged on the 20 validation cases, for the four studied RapidPlan models (CL-1 and CL-2, TP-1 and TP-2). (a) Near-to-maximum (D1%) or mean doses to the most salient OARs and non-target tissue. (b) D2% and D98% for PTV_boost, D5% and D95% for PTV_elective, and standard deviation of the dose in the two targets, to evaluate the targets dose homogeneity