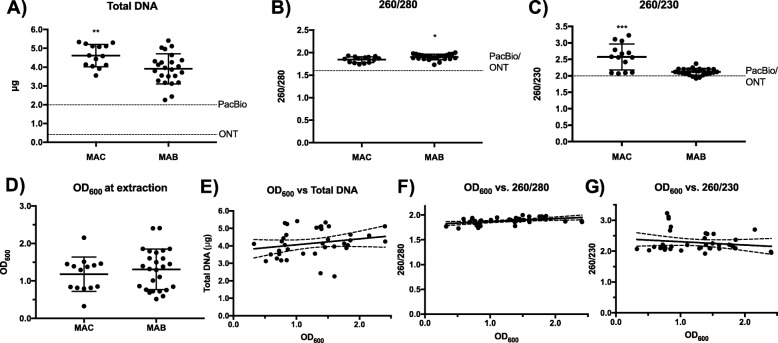
Fig. 2.
Quantity and quality of DNA extractions of 38 MAC and MABSC clinical isolates using optimized DNA extraction method. a Total DNA by Qubit® and b 260/280 and c 260/230 by NanoDrop 2000 UV-Vis Spectrophotometer. Significance by unpaired t-test with p-values as 0.033 (*), 0.002 (**), < 0.001 (***). d OD600 at the time of extraction by species complex (ns). Scatter plots with lines of best fit for (e) OD600 versus total DNA (ns), (F) OD600 versus 260/280 showing a positive relationship (p = 0.0033, R2 = 0.2051), and OD600 versus 260/230

