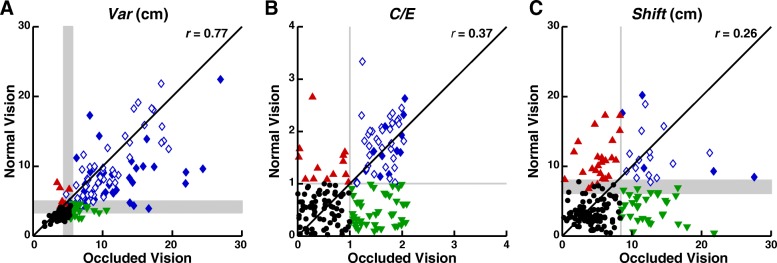
Fig. 3.
Relationships between measures of position sense with occluded and normal vision. Plots show the relationships for Var (a), C/E (b) and Shift (c). Black circles show subjects who were Normal in both conditions. Green triangles show subjects who showed Full compensation with normal vision. Blue diamonds show subjects who were Impaired in both conditions. Closed blue diamonds indicate subjects who exhibited Partial compensation and open blue diamonds indicate subjects who displayed Absent compensation. Red triangles show subjects who showed Inverse compensation (Normal with occluded and Impaired with normal vision). Grey shaded areas indicate areas in which performance classification (Impaired or Normal) varied with age, such that one extremity defined the boundary for a 20-year-old subject and the other extremity defined the boundary for a 90-year-old subject

