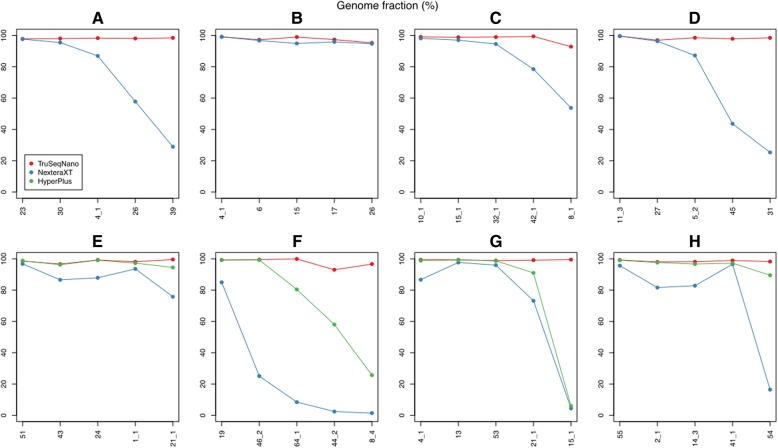
Fig. 2.
a–h Genome fraction of internal reference bins recovered in test assemblies. Each panel depicts the performance of the top five reference bins from a separate sample. Reference bins are ordered from the highest to the lowest average recovered genome fraction across the library prep methods tested for that sample (x-axis categories are not comparable between panels)

