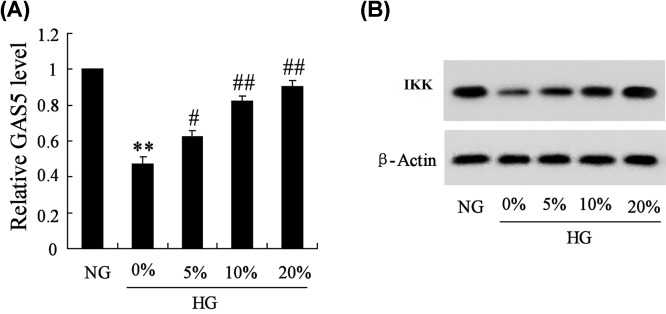
Figure 1. Mouse renal mesangial cells (SV40 MES-13) were treated with 5.6 mM glucose (NG), 30 mM glucose (HG)+DGTXT (0, 5, 10 and 20%).
(A) The expressions of GAS5 in SV40 MES-13 cells were detected in NG, 0% HG, 5% HG, 10% HG, 20% HG groups. (B) Protein levels of IKKin NG, 0% HG, 5% HG, 10% HG, 20% HG groups. ** P<0.01, compared with NG group.## P<0.01, compared with HG group.

