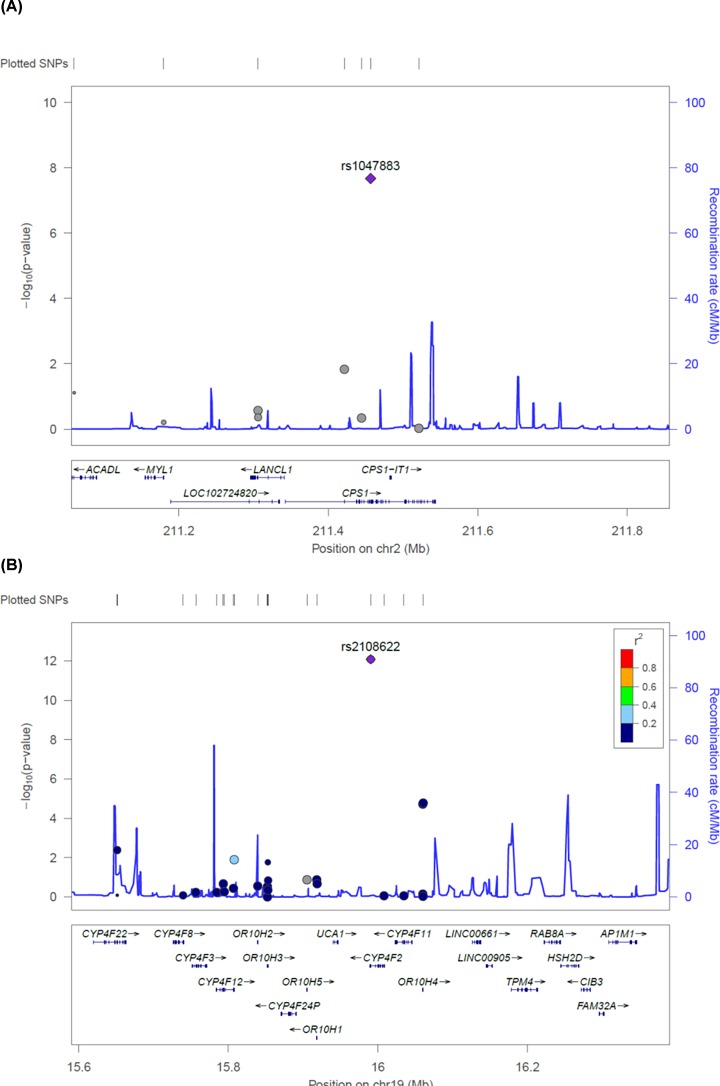
Figure 2. Regional plots for two significantly associated non-synonymous variants with T2D-related metabolites.
Variants are plotted by position on chromosome (x-axis) and log-scaled P-value (y-axis). The rs numbers for the most significant non-synonymous variants are shown on the plots. Recombination rates estimated based on 1000Genomes database are plotted in blue color to reflect local LD structure. The variants near the most significant markers are colored according to LDs between them (taken from pairwise r2 values from the 1000Genomes Asian database). Genes, the position of exons and the direction of transcription are also plotted.

