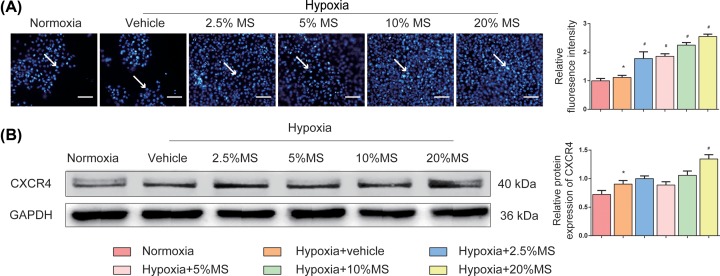
Figure 5. HSHS MS promotes endothelial cell migration in vitro.
(A) Representative images for transwell migration assay of vascular endothelial cells (indicated by white arrows), and quantitative results. Scale bar = 300 μm. n=5. (B) Western blotting results for CXCR4 and quantitative results of relative protein expression of CXCR4 to GAPDH. n=3. Data are presented as mean ± SD. *P<0.05 vs. Normoxia, #P<0.01 vs. Hypoxia+vehicle.

