
Figure 4.
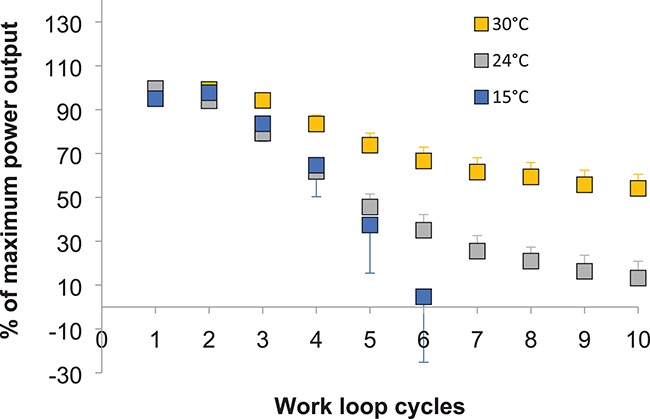
Fatigue resistance of power production improved as test temperature increased during a series of work loops in X. tropicalis iliotibialis muscle. Orange, grey, and blue symbols represent 30°C, 24°C, and 15°C data, respectively, for individuals housed at 24°C. Data represented as mean ± sem, n = 8, plotted as a percentage of the maximum power output produced by each individual. Based on data presented in James et al. (2012).