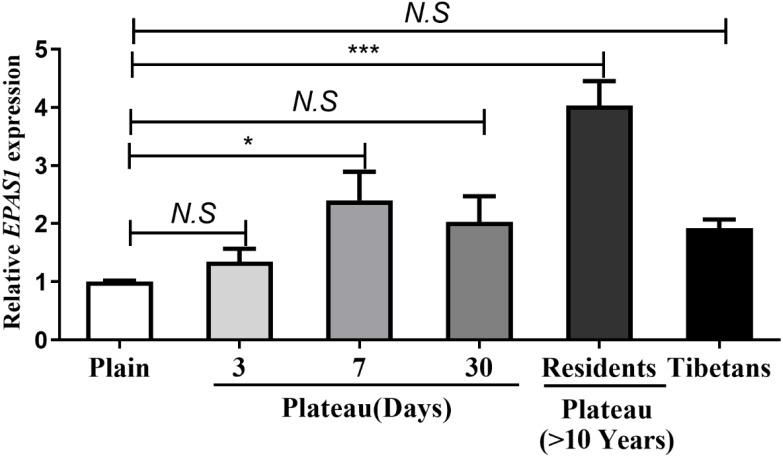
Figure 2. The differences in EPAS1 mRNA expression between the Tibetan and Han populations.
mRNA was extracted from peripheral blood in different group and reversed into cDNA, and RPL13A was used to calibrate sample loading. *P < 0.05 or ***P < 0.001 for indicated group versus plain group. N.S: No statistical difference.

