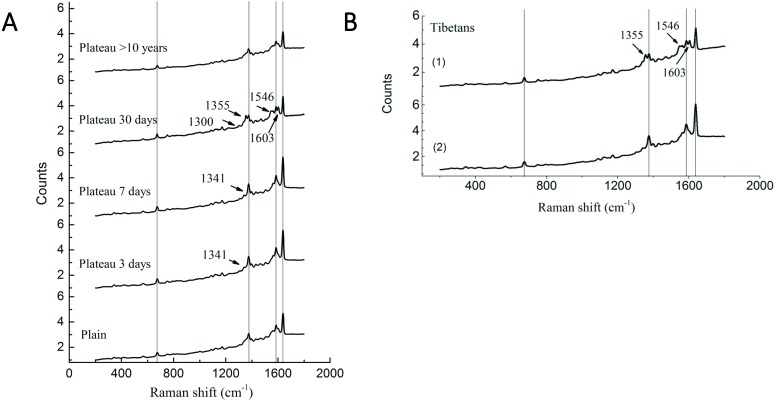
Figure 4. Raman spectra of RBC in Tibetans and plain population.
Comparison of the spectra recorded for the different group (A) Han population before or after entering plateau and (B) Tibetan population using 514 nm laser excitation wavelengths, showing the major band assignments in the range of 500–2,000 cm−1.

