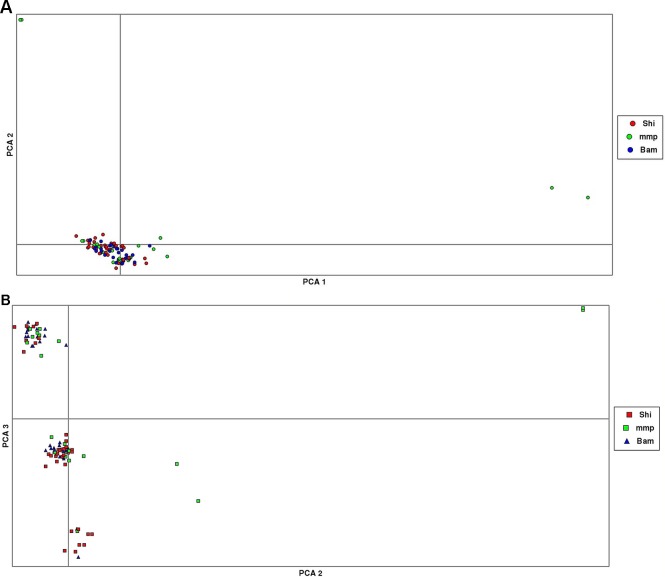
Figure 3.
Principal component analysis (PCA) plots showing clustering of samples collected from Mombasa Marine Park (MMP), Shimoni (Shi), and Bamburi (Bam). (A) (PCA1, PCA2) showing one major cluster grouping samples from all localities and two minor clusters, which consists of samples from the marine park only; (B), PCA (PCA2, PCA3) showing three clusters consisting of samples from all localities.

