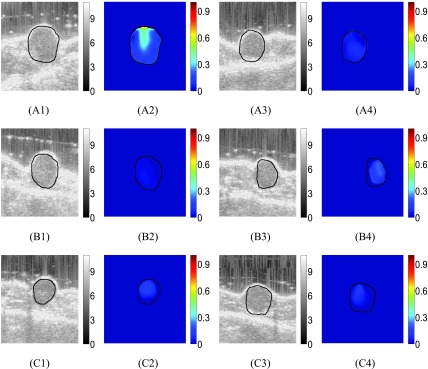
FIGURE 6.
B-mode images of treated mouse #1 at three time points (week 1, week 2, week 3) are shown in (A1), (B1) and (C1). Reconstructed SSn distributions (dimensionless) at the same time points are shown in (A2), (B2) and (C2). B-mode images of treated mouse #2 at three time points (week 1, week 2, week 3) are shown in (A3), (B3) and (C3). Reconstructed SSn distributions at the same time points are shown in (A4), (B4) and (C4).

