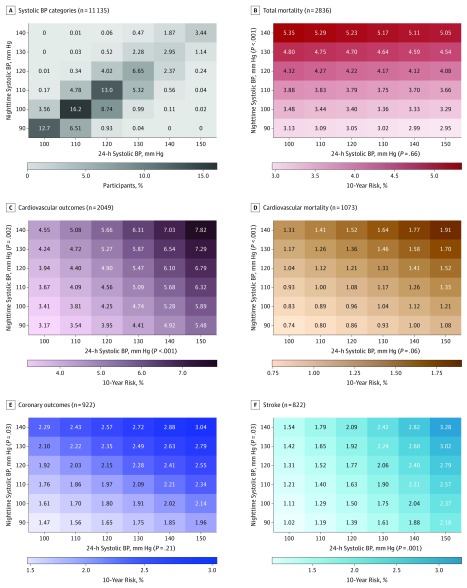
Figure 1. Heat Maps Depicting 10-Year Risk in Relation to 24-Hour and Nighttime Systolic Blood Pressure in 11 135 Study Participants.
Derived by Cox proportional hazards regression with 24-hour and nighttime systolic blood pressure (BP) analyzed as continuous variables. Estimates of 10-year risk were standardized to the average of the distributions in the whole study population (mean or ratio) of all covariables. Numbers in the panel A grid represent the percentage of participants within each systolic BP cross-classification category; numbers in the other grids represent the 10-year risk.
See the Results section for P values along horizontal and vertical axes. Risks of total mortality, cardiovascular mortality, and a coronary event were not significantly associated with 24-hour systolic BP (P ≥ .06).

