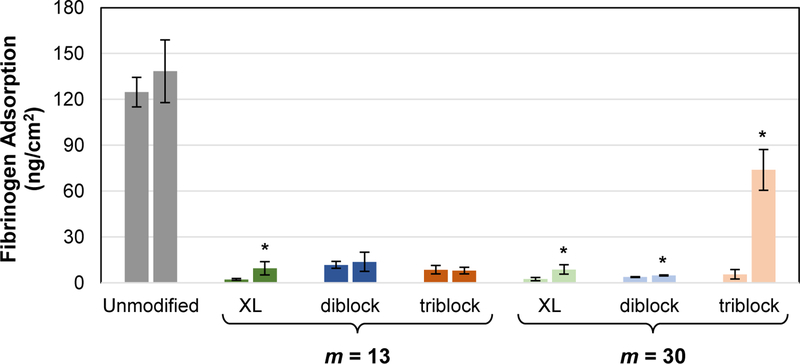
Figure 6.

Fibrinogen adsorption (concentration = 3 mg/mL; exposure time = 1 h) onto silicones modified with SMA amphiphiles (“XL diblock”, “diblock” and “triblock”; m = 13 and 30 for each) before (t = 0) and after 2 weeks exposure to water (t = 2 weeks). For each composition fibrinogen adsorption was measured before and after water-equilibration as represented by the left and right bars, respectively. Each individual bar represents the average fibrinogen adsorption of three identically prepared replicate wells with the error bars representing the standard deviations. Statistical analysis was done using single factor Anova. Fibrinogen adsorption values were compared at t = 0 versus t = 2 weeks (* indicates p < 0.05).
