Figure 1.
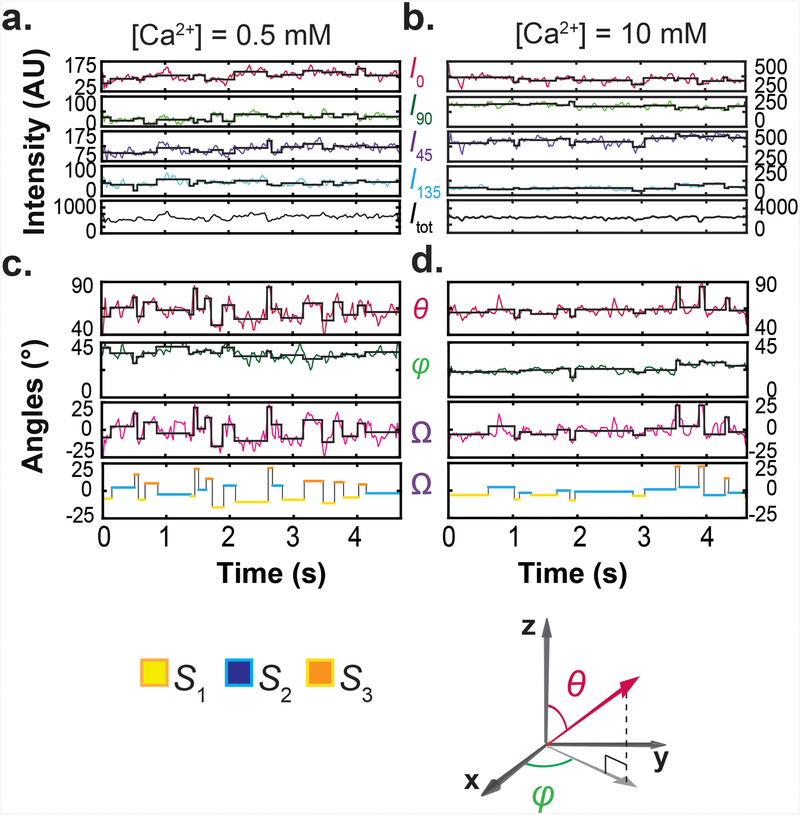
Polarized-fluorescence intensities and calculated Itot, θ, φ and Ω at two Ca2+ concentrations. a, b. Four intensity components (I0, I45, I90 and I135) of single particles recorded over ~5 seconds in 0.5 mM (a) and 10 mM (b) Ca2+, and Itot calculated from I0, I45, I90 and I135. c, d. Values of θ and φ calculated from the four intensity components and values of Ω calculated relative to S2. Transition points of the black traces superimposed on the experimental intensity and angle traces were determined by a changepoint analysis whereas the constant values between the transitioning points are means of the observed data. For easy visualization, a colored-for-conformational-state version of the black trace for Ω is shown below. For reference, coordinate systems are shown at the lower right corner.

