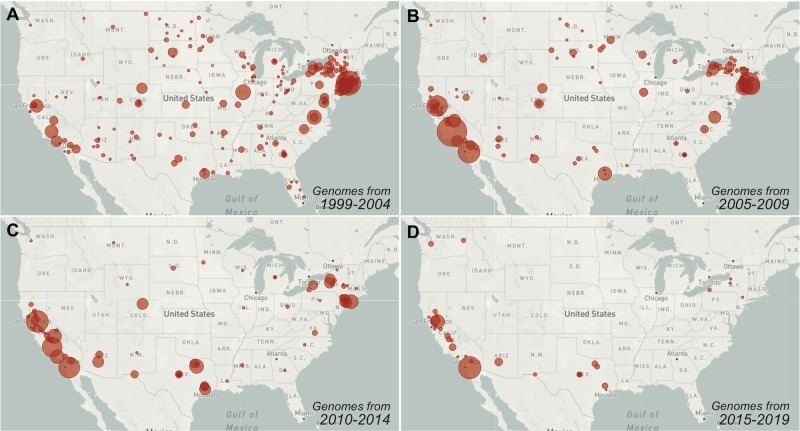
Fig 5. Gaps in recent WNV sampling hinder the usefulness of virus genomic analyses.
Following the initial interest in sequencing WNV, the number of available genomes for research has continued to decrease. The circle sizes represent the relative number of near-complete WNV genomes available from each collection location (county) per 5-year period. There are currently (A) 728 available WNV genomes from 37 states from 1999 to 2004, (B) 789 WNV genomes from 22 from 2005 to 2009, (C) 541 WNV genomes from 22 states from 2010 to 2014, and (D) 190 WNV genomes from 5 states from 2015 to 2019 (all counts are as of June 2019). Data from specific times can be visualized on Nextstrain using the “Date Range” function. Live displays of the data can be found at (A) nextstrain.org/WNV/NA?c=num_date&d=map&dmax=2004-12-31&f_country=USA&r=division, (B) nextstrain.org/WNV/NA?c=num_date&d=map&dmax=2009-12-31&dmin=2005-01-01&f_country=USA&r=division, (C) nextstrain.org/WNV/NA?c=num_date&d=map&dmax=2014-12-31&dmin=2010-01-01&f_country=USA&r=division, (D) nextstrain.org/WNV/NA?c=num_date&d=map&dmax=2019-12-31&dmin=2015-01-01&f_country=USA&r=division.

