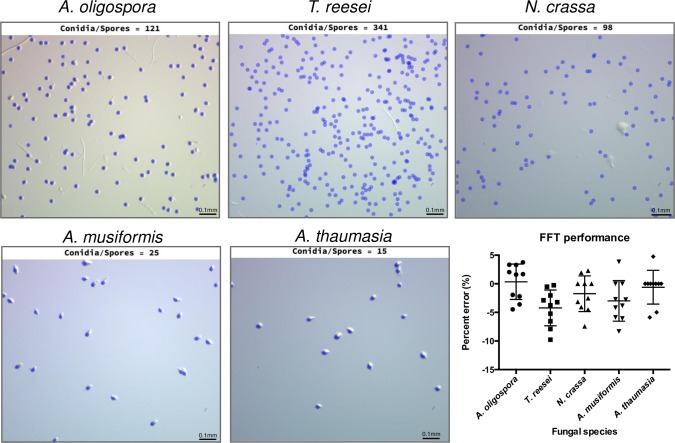
Fig 2. Results of the conidia/spore counting function of FFT for five different fungal species.
Example of the conidia detected by FFT (blue) overlaid on the original images for each of the studied fungal species. Bar chart representing the performance of FFT as percent error between the conidia detected by FFT versus the number of manually counted conidia for 10–15 images per species.

