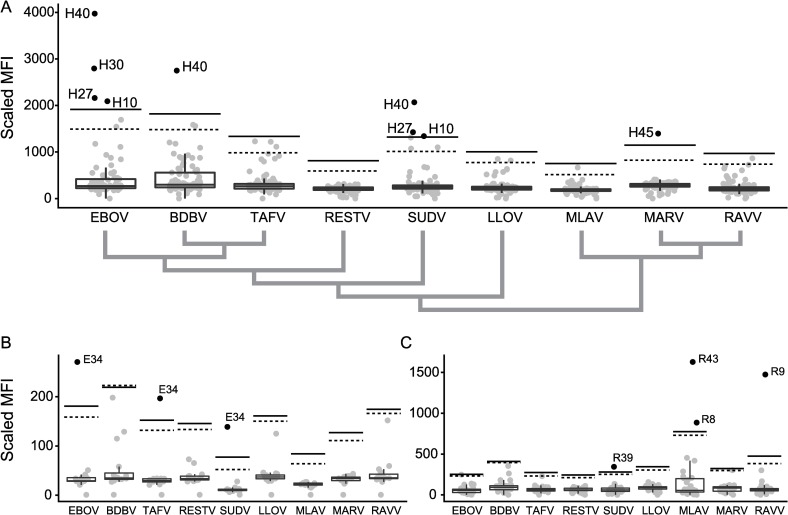
Fig 2.
MFI values for sera obtained from humans (A), Eonycteris spelaea (B), Rousettus leschenaultii (C). Antibodies reactive to filovirus GPe from Ebola virus (EBOV), Bundibugyo virus (BDBV), Taï Forest virus (TAFV), Sudan ebolavirus (SUDV), Reston virus (RESTV), Lloviu virus (LLOV), Měnglà virus (MLAV), Marburg virus (MARV), and Ravn virus (RAVV) are quantified in a bead-based fluorescence assay. Grey dots represent individual samples. A boxplot is overlaid to indicate median, quartiles and extremes of the sample distribution. A black dashed line indicates the cutoff determined from a single lognormal curve-fit and a black solid black line the three-fold increase over the mean. A cladogram in panel A indicates the phylogenetic relationships of individual filovirus GPe based on their amino acid sequence.

