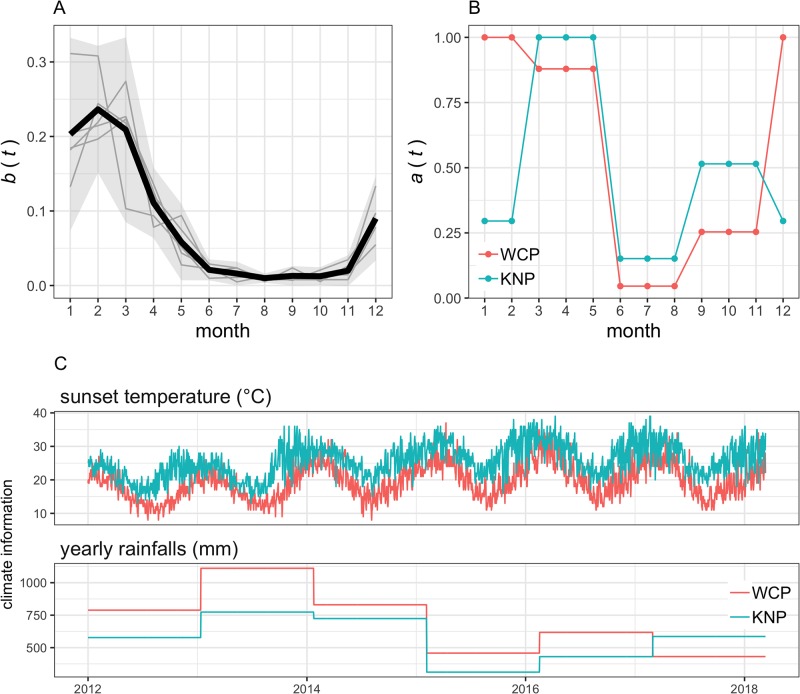
Fig 2. Time-related functions and variables used in the model.
(A) The zebra birth function b(t) as defined by the monthly density of the annual number of births of plains zebra in the Kruger National Park (KNP) between August 1969 and March 1973. Solid grey lines show the adjusted birth data used to calculate b(t) and extracted from Smuts [17] who reported the temporal variation in the proportion of <1-month-old foals for two populations of KNP. Black solid line and grey envelop shows the birth function b(t) and its 95% confidence interval. Note that . (B) The activity function a(t) of Culicoides imicola as defined by the proportion of the maximum number of C. imicola per hosts per day recorded in each month in the Western Cape Province (WCP) and KNP. Data extracted from Venter et al [19]. Trap catch records from Stellenbosch and Eiland (see Fig 3A for location) were used to characterise midge activity in the WCP and KNP, respectively. (C) Daily variations in sunset temperature and variations of the annual rainfalls recorded in Stellenbosch (WCP) and Eiland (KNP).

