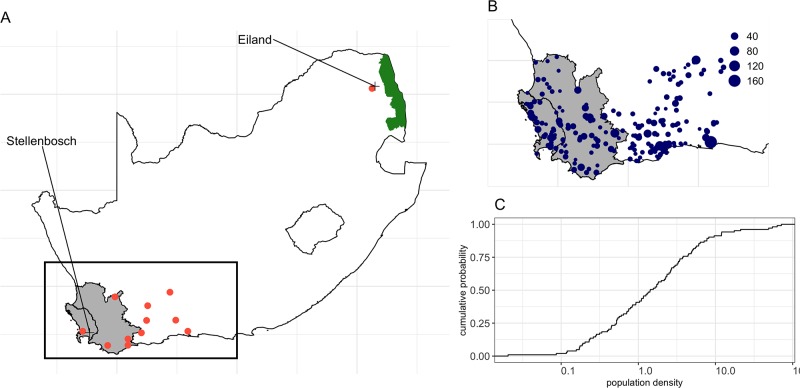
Fig 3. Study area and holdings with a reported population of plains zebra.
(A) Location of the 12 sites in which climate data were extracted from. Red solid dots indicate sites at which climate information were downloaded, whereas crosses indicate the location for which midge abundance data were reported in Venter et al. [19]. Rectangle represents the extent of the study area. (B) Location of the 212 holdings with at least 1 reported plains zebra that were considered in this study. Size of each dots are indicative of the size of the zebra population. (C) Distribution of the population density of the 102 holdings with at least 1 reported plains zebra and a known surface area. Grey shaded areas in A and B represent the AHS controlled area of the Western Cape Province, while the green shaded area in A is the Kruger National Park (KNP). Note that the x-axis in C is log10-scaled.

