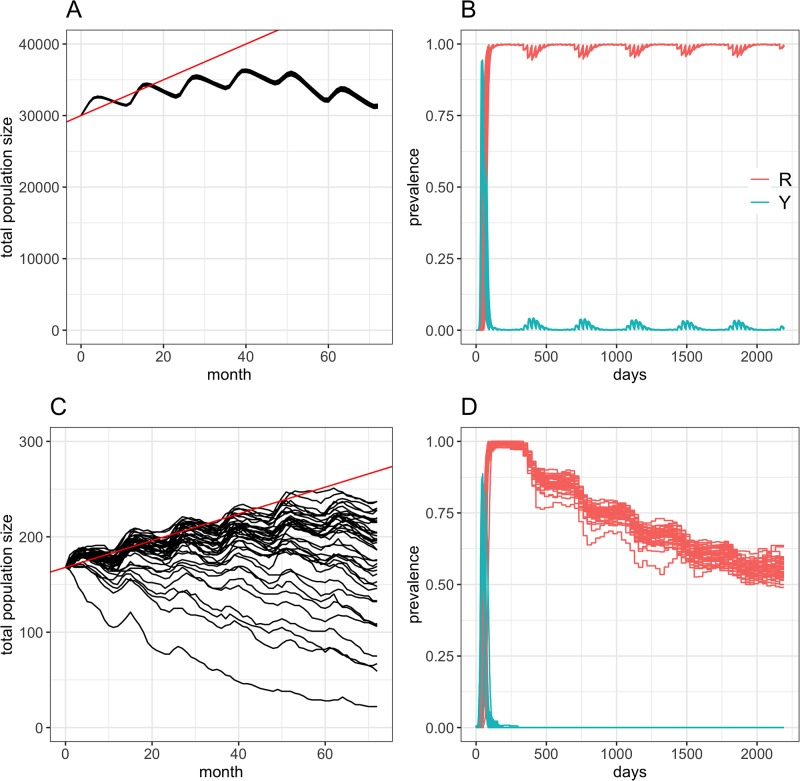
Fig 4. Baseline dynamics of the plains zebra population and AHS prevalence after introduction at the start of the study period in KNP and the WCP.
(A-B) Temporal evolution of the predicted number of plains zebras (A) and those that are in the infectious and immune states (B) following 40 independent incursion events occurring on January 1st 2012 in the KNP plains zebra population. (C-D) Temporal evolution of the predicted number of plains zebras (C) and those that are in the infectious and immune states (D) following 40 independent incursion events occurring on January 1st 2012 in the WCP plains zebra population. We assumed that the KNP population of plains zebra (A and B) included 30,000 individuals at the start of each simulation. Similarly, we considered incursions in the WCP (C and D) occurred in the largest population of plains zebra reported in the area (N = 168) at the start of each simulation. Solid red lines in A and C are the 10% annual increase in population size. Note the difference of scales in the y-axis.

