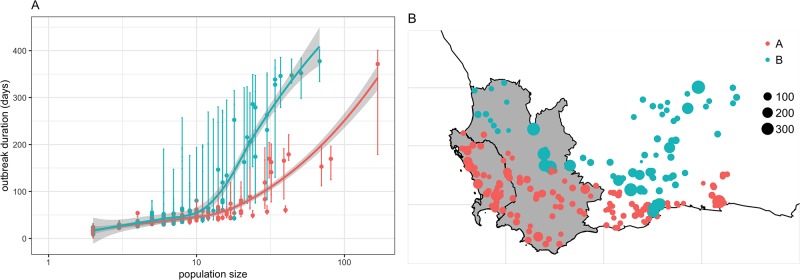
Fig 6. Distribution of the risk of AHS persistence as a function of the size of the plains zebra population in all individual holdings in the WCP.
(A) Median, and IQR, duration of AHS outbreaks in all holdings considered in the WCP. This distribution shows two groups (groups “A” and “B”) of holdings differing from outcomes of AHS incursion events. (B) Spatial distribution of the risk of AHS persistence stratified by their group. Note that the large error bars in (A) highlight the large uncertainty for holdings that has no record of surface areas. Curves in (A) are the smoothed conditional means of the median outbreak duration. Size of dots in (B) represent the median outbreak duration (in days).

