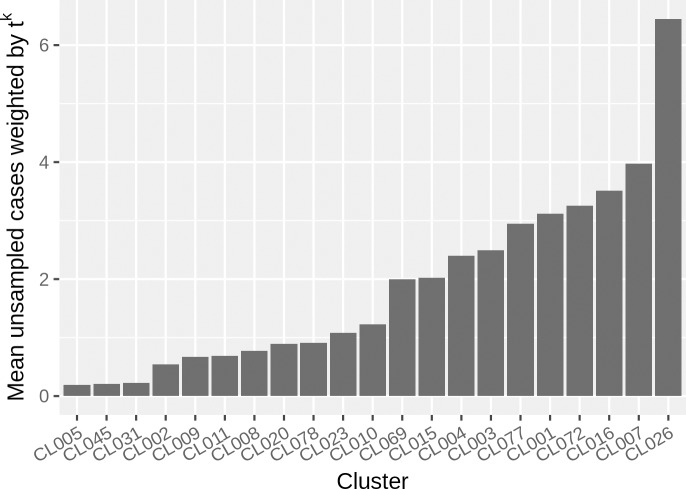
Fig 2. Weighted mean number of unsampled tuberculosis cases.
For each posterior transmission tree, we associate a weighting factor tk, where k is the number of sampled cases for which transmission happened after diagnosis, and t = 0.1. This accounts for the fact that individuals are treated once diagnosed, and so are less likely to transmit. This figure shows the mean number of unsampled cases for one of the simulated clock rates (0.363). The results for all clock rates appear in S5 Fig.

