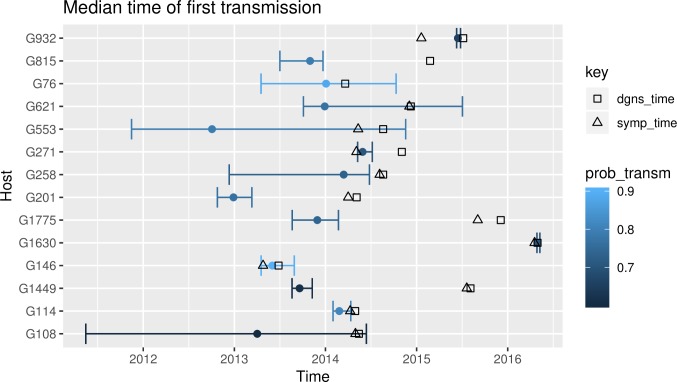
Fig 4. Resampled median time of first transmission.
The graph represents the median time of the first highly likely transmission for individuals for whom the posterior probability of transmitting (prob_transm) was greater than 0.6, under a clock rate value of 0.363 SNPs/genome/year. For each case, the diagnosis time (dgns_time; squares) and, where known, the symptom onset time (symp_time; triangles) are added. Analogous graphs for different transmission probability cutoffs, and without cutoffs, are shown in S6–S12 Figs.

