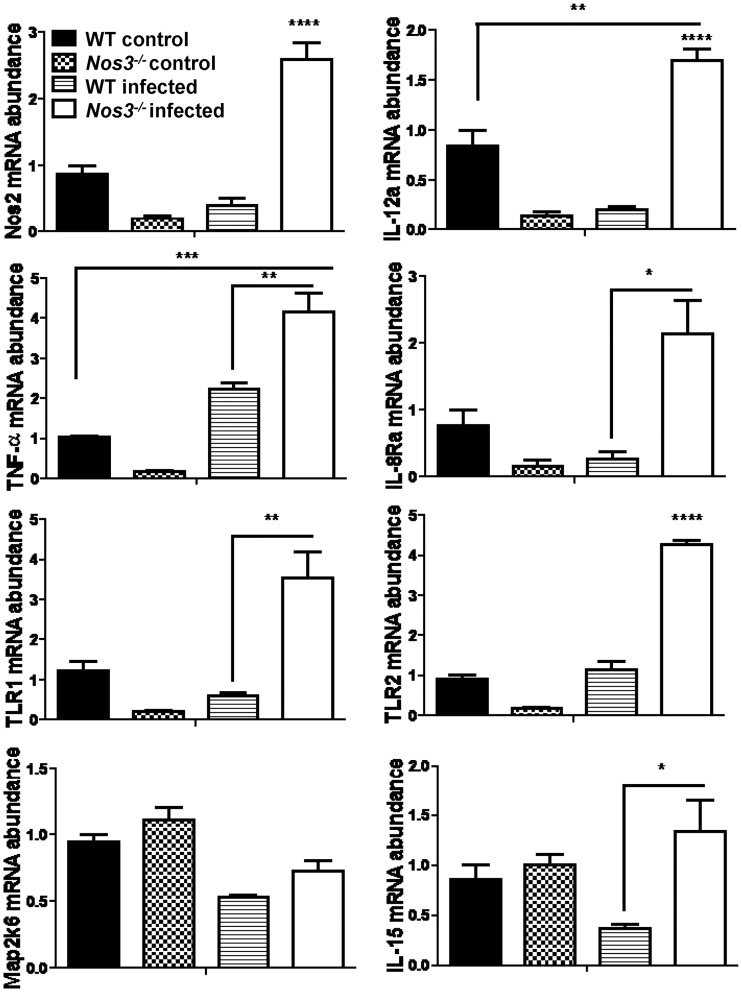
Fig 6. Effect of eNOS on local inflammatory gene expression induced in infected kidneys.
mRNA abundance was determined by qPCR using cDNA synthesized from total RNA from kidneys to validate selected genes from the NanoString data in Table 1. Expression in uninfected WT and Nos3-/- mice was compared with that in the infected WT and Nos3-/- mice. Each group had at least three mice and confirmed that Nos2, Il-12a, TNF-a, IL-8Ra, TLR-1, TLR-2 and IL-15 expression in kidneys were significantly up-regulated in infected Nos3-/- mice compared with the WT infected mice (* = p <0.05; ** = p <0.01; *** = p <0.001, **** = p <0.0001). Results from three mice per group were analyzed using two-way ANOVA with post Bonferroni comparison test.

